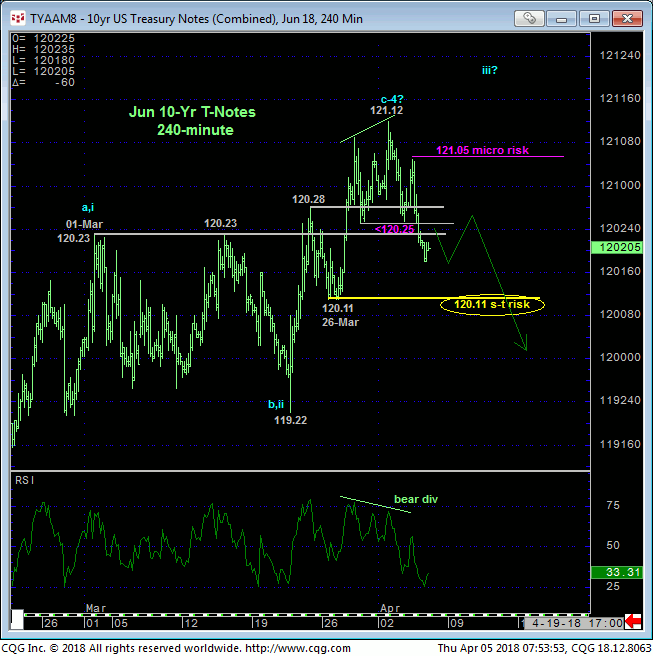
The market’s failure yesterday afternoon and overnight below 28-Mar’s 120.25 minor corrective low confirms a bearish divergence in short-term momentum as detailed in the 240-min chart below. This mo divergence defines Mon’s 121.12 high as one of developing importance and possibly the end of a relatively broader 3-wave correction from 15-Feb’s 119.14 low in the Jun contract.
Yesterday’s resumed slide below Tue’s 120.255 initial counter-trend low leaves yesterday’s 121.05 high in its wake as the latest smaller-degree corrective high and new micro risk parameter this market now needs to recoup to r3ender this week’s sell-off attempt a 3-wave and thus corrective affair that would re-expose the past month-and-a-half’s broader recovery. In lieu of such 121.05+ strength and especially if this slide breaks 26-Mar’s 120.11 corrective low and our short-term risk parameter, a more significant peak/reversal process could morph into a resumption of the secular bear market.
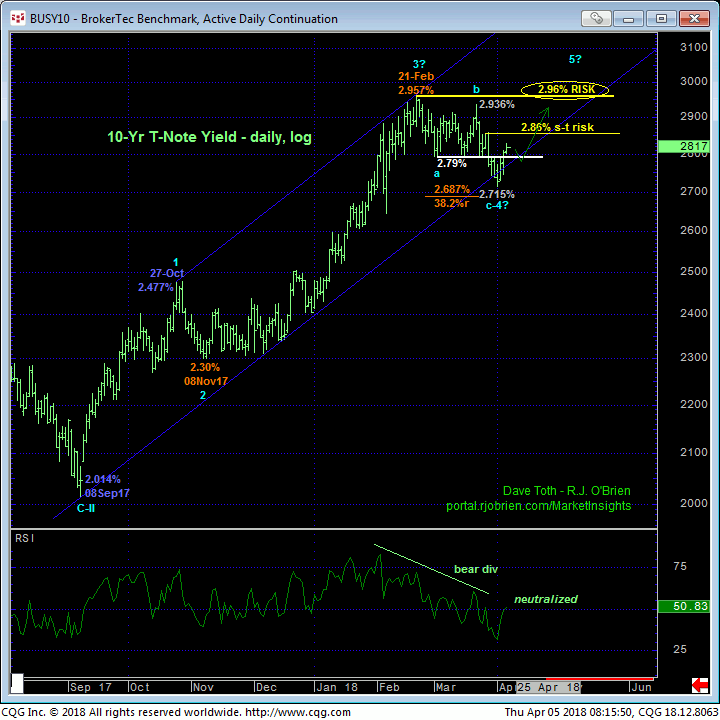
Against the backdrop of the major trend higher in rates shown in the daily log scale chart below, the setback attempt from 21-Feb’s 2.957% high yield is easily seen as a mere correction ahead of an eventual resumption of the broader uptrend. The market’s failure to sustain losses below 02-Mar’s 2.79% initial counter-trend low provides “some” base/reversal evidence, but a recovery above at least our short-term risk parameter defined by 27-Mar’s 2.86% high remains required to, in fact, break the downtrend from at least 21-Mar’s 2.936% high, let alone 21-Feb’s obviously key 2.96% high and key risk parameter.
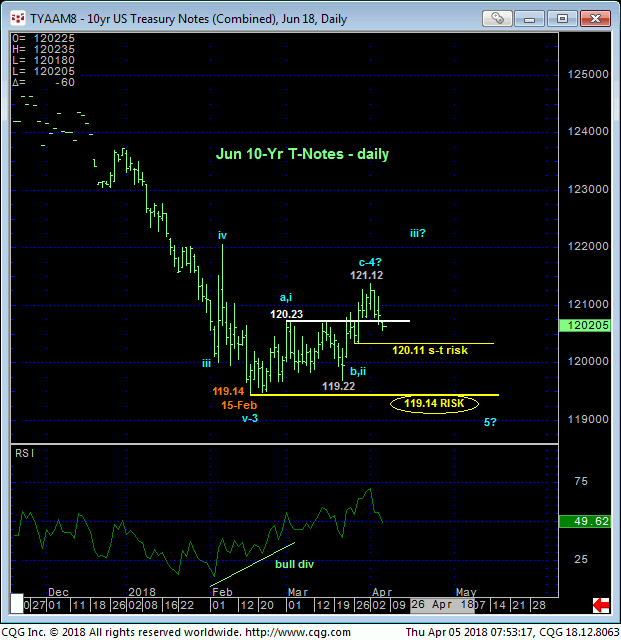
Basis the Jun contract these risk parameter toggle points cut across at 120.11 and 119.14, respectively. And while it is premature to conclude the month-and-a-half recovery from 15-Feb’s 119.14 low has ended, this week’s slip provides enough evidence to speculate cautious and objectively from the bear side with a recovery above at least 121.05 required to threaten this call.
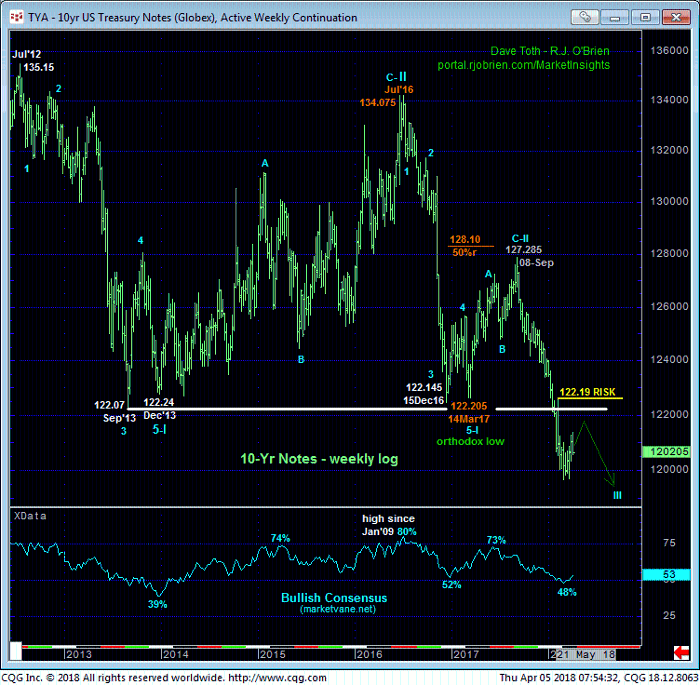
It’s easy to see the merits behind a new secular bear market in T-note prices in the weekly log scale chart below. Jan’s clear break below more than FOUR YEARS’ support from the 122-handle. in fact, reinstates and reaffirms the new secular bear trend that MINIMALLY requires a recovery above early-Feb’s 122.19 corrective high to even defer, let alone threaten. Against this major bear trend backdrop and following yesterday’s admittedly short-term momentum failure, it’s not at all hard to fathom a resumption of the major bear market following a key economic report like tomorrow’s nonfarm payroll report for March.
These issues considered, traders are advised to return to a cautious bearish policy from 120.24 OB with a recovery above 121.05 required to threaten this call enough to warrant its cover. Below we recommended a cautious but favorable risk/reward option strategy to engage tomorrow’s key report while also being able to get a good night’s sleep tonight.
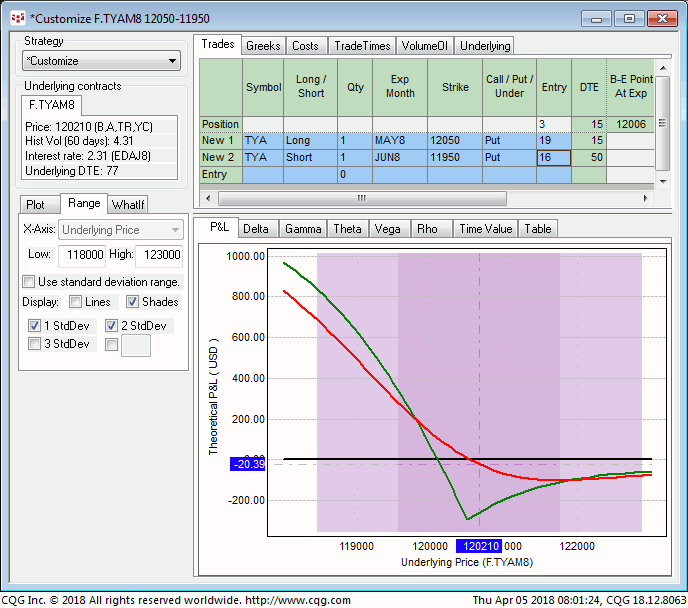
The May 120-1/2 / Jun 119-1/2 Put Diagonal spread involves buying 1-unit of the May 120-1/2 Puts around 19/64s and selling 1-unit of the Jun 119-1/2 Puts around 16/64s for a net cost of 3/64s ($46.87 per 1-lot position). This strategy provides:
- a current net delta of -0.17
- 2.5:1 gamma ratio
- negligible risk should the underlying Jun contract continue to rally
- profit potential of up to 61/64s ($953.12 per 1-lot position) on a sustained move south below 119.14.
As always in long-gamma strategies in which theta, or time decay, is what comes in exchange for those gamma benefits, a dud of a report and languishing, mere lateral price action is least desirable. Under such market-flatlining circumstances the long option could eventually erode to zero whilst leaving a naked short position in the Jun 119-1/2 puts that could come back to haunt if our long-term bearish count resumes later rather than sooner. Under these condition the risk to this strategy could be catastrophic. BUT this risk is easily countered by simply covering this trade at what should be a small loss by mid-to-late-next week if the market doesn’t either decline OR RALLY sharply.
Please contact your RJO representative for an updated bid/offer in the May 120-1/2 / Jun 119-1/5 Put Diagonal strategy.
