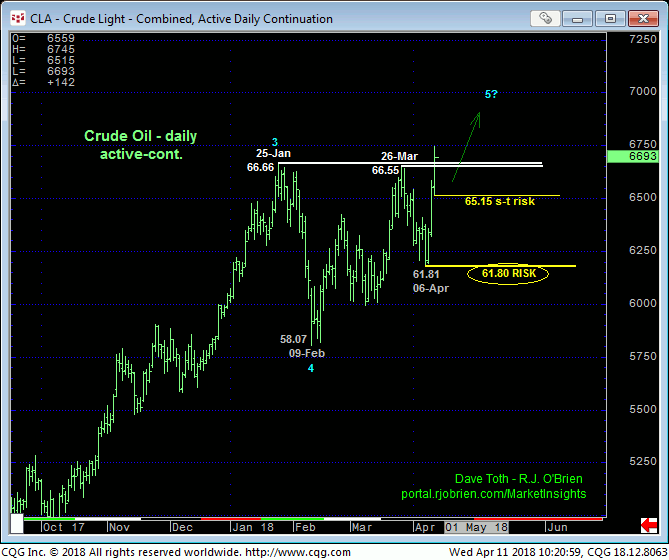
With today’s impulsive break above the 66.55-to-66.66-area that has provided significant resistance since late-Jan, the market has reaffirmed our long-term bullish count and exposed an area totally devoid of any technical levels of merit. In effect, there is no resistance, with all pertinent technical levels now existing only below the market in the forms of former 66.50-area resistance-turned-support and prior corrective lows like 65.15 and 61.81 we’ll detail below.
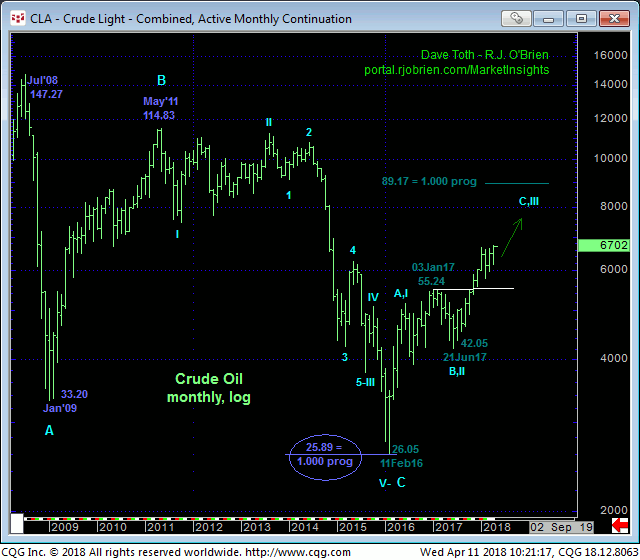
Indeed, the monthly log scale chart below shows the market establishing new highs for the 2-YEAR uptrend and trading at prices not seen since Dec’14. Only a glance at the this chart is needed to see that there are NO levels of former price action shy of the 80-to-110-area in which the 2011-to-2014 battleground took place.
Traders are reminded that in such instances when a trend is establishing major new highs, ALL “derived” technical levels like Bollinger Bands, channel lines, imokus, the ever-useless moving averages and even the vaunted Fibonacci progression relationships we cite often are totally useless. These levels merely derived from previous data points never have proven to be reliable reasons to identify and expect resistance without an accompanying CONFIRMED bearish divergence in momentum needed to, in fact, break the clear and present uptrend. And they NEVER will.


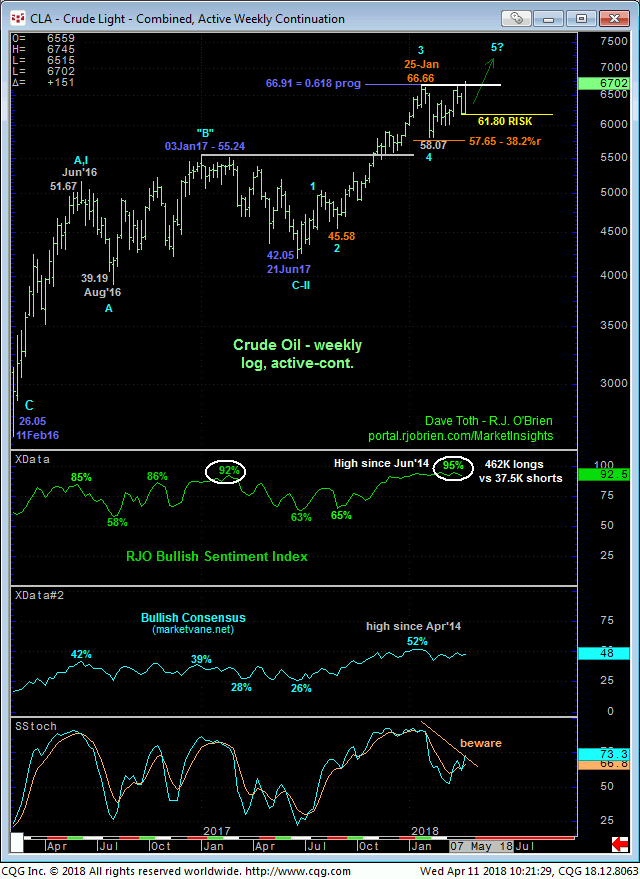
Our RJO Bullish Sentiment Index of the hot Managed Money positions reportable to the CFTC remains historically frothy and typical of major PEAK/reversal environments. But traders are also reminded that sentiment is not an applicable technical tool in the absence of a confirmed bearish divergence in momentum needed to break the uptrend. Herein lies the importance of identifying corrective lows like Fri’s 61.81 low as a specific and objective parameter from which to rebase and manage the risk of a bullish policy.
Former 66.50-area resistance would be expected to hold as new support if the market has a much broader move higher in store. A failure below will confirm a bearish divergence in momentum that, combined with frothy levels in our RJO BSI, could leave the market prone to a significant correction lower. In lieu of such sub-61.80 weakness the trend is up on all scales and should not surprise by its continuance or acceleration.

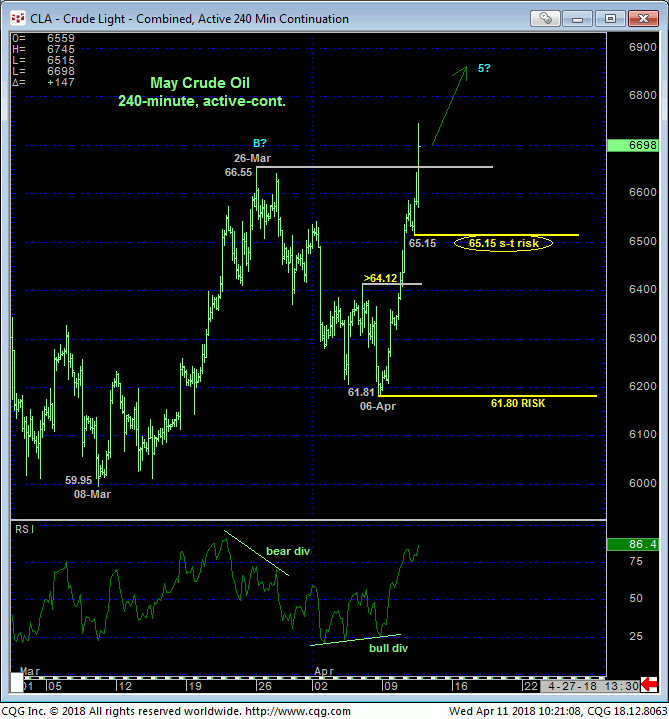
On a much shorter-term scale the 240-min chart below shows today’s rally leaving today’s 65.15 low in its wake as the latest smaller-degree corrective low this market is now minimally required to fail below to threaten then impulsive integrity of a more immediate bullish count. In this regard 65.15 is considered our new short-term risk parameter to an advised bullish policy.
These issues considered, today’s breakout above hugely important 66.66-area resistance reaffirms and reinstates the secular bull market that once again warrants a bullish policy. Traders are re-establish bullish exposure on a scale-down from at-the-market (67.10) to 66.50 with a failure below 65.15 required to defer or threaten this call enough to warrant paring or neutralizing exposure. In lieu of such weakness we believe further and possibly extensive, multi-month gains have been exposed straight away, including a run to the 80-to-90-range.


