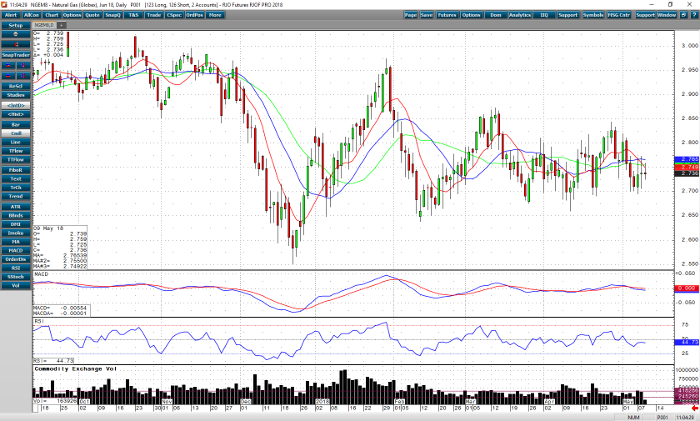
The trend in June natural gas is slightly down. It has been trading in a range between 2.700 and 2.800 since mid-March. The short-term moving averages are heading south. Momentum indicators are at mid-levels and are travelling sideways. As always, we are looking for divergence in momentum and price action in the market to choose direction. Support is right around 2.700, and a close beneath 2.690 should signal a selloff, taking aim at April low 2.660 and below. Resistance is around the 2.800 level. Closes above this should be enough to stem the tide and put the bulls back in the driver’s seat.
Tomorrow’s EIA estimate for gas storage is 81 bcf. This is above the 5-year avg. of 75 bcf. The injection should keep pressure on the prices and take them lower. Above average temperatures for the foreseeable future lends a bit of support, but not enough to concern traders with cooling demand. Warmer weather has put heating demand for gas behind us for this year. Exposure to the short side is recommended.
Natural Gas Jun ’18 Daily Chart


