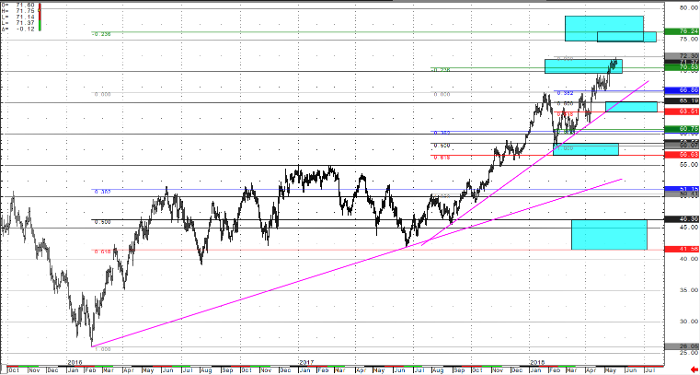
This week the EIA Petroleum Status Report showed a slowdown in US oil production, with US stockpiles losing -1.4 million barrels. This continues after last week’s -2.2 million barrel draw showing a week over week demand for WTI crude. US refineries were operating at 91.1% of their capacity, a .07% rise compared to last week, is the likely reason for the increased crude consumption. With WTI crude flagging sideways at multi-year highs, the supporting fundamentals suggest the path of least resistance is still higher in the near-term. It’s also worth noting, the current run up in crude prices could be the result of pipeline constraints, where US shale oil fields are having trouble moving the product to market. This is generally because pipelines are at capacity, and with pipeline expansion projects in the works, WTI producers are having to rely on the more expensive means of trucking crude from fields to refineries.
With a constraint in the ability to get oil out of production areas, coupled with tensions in the Middle East, and an increase of US gasoline production (in anticipation of seasonal summer demand), the price of WTI crude seems to be justifiable in its support. With the run up confirming, some conditions are starting to suggest short-term over bought conditions, but with each selloff to the low end of its current range, those conditions seem to be unwound and buyers keep prices stable. While a Fibonacci support zone has already provided a bounce from the $58.50 to $58.00 inflection zone (blue boxes on chart are Fibonacci inflection zones), WTI crude futures have begun their climb towards these inflection zone targets clustered between $70 and $76 a barrel. The short-term target from $58.00 (which is at $71) has been hit, and a pullback is often times the result of profit taking rather than the start of a reversal in trend. If WTI crude prices break back into the multi-year range (below $65), traders can expect support into the $63.80 and $58.00 inflection zones. Before this situation can even be considered, WTI crude price would need to settle below $65.00 a barrel. Until then, expect buyers in the dips, and for the price of WTI crude to continue to test the $70.00 handle, and a break above could lead to a test of $76.00.
In my opinion, the rally that has taken WTI crude prices above the $66.66 continuous contract highs (into the end of 2017 and start of 2018) is still at the forefront of traders’ minds. The fight over trend seems to be all but won by the bulls, which had been ruminating for most of the month of April. While technical upside price projection targets have been hit, there may be an opportunity to position for the resolving push to test above $70.00 and hit those technical $76 upside targets, in pullbacks to test $65.00. With WTI Crude prices above prior multi-year highs, the trend is up until it’s not (and I like to think, trend is my friend). When a market speaks, you must listen, and WTI crude may be telling us this is the beginning of a much larger trend being born.
Crude Oil Daily Continuation Chart


