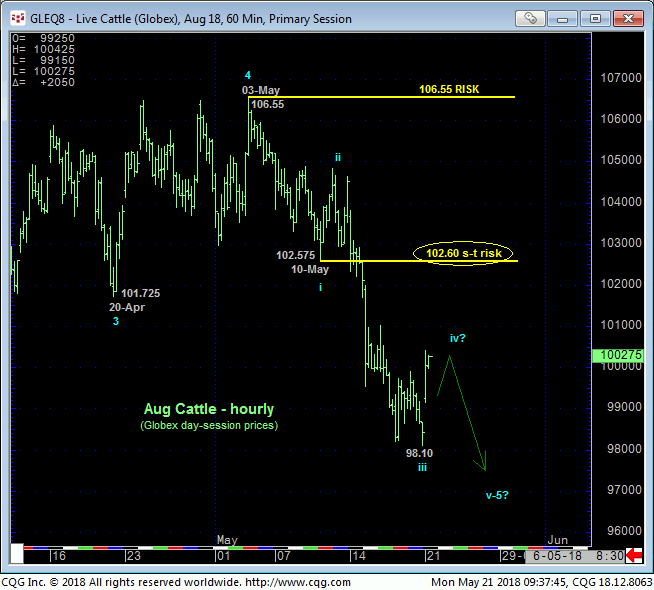
Last week’s resumed losses in the now-prompt Aug contract reaffirm our broader bearish count last updated in 15-May’s Technical Blog that concluded Apr’s recovery attempt was a corrective event within a still-unfolding major downtrend from last Nov’s major highs. The hourly chart below shows May’s trendy, impulsive decline to new lows for the 6-month downtrend that leaves 03-May’s 106.55 high in its wake as the latest larger-degree corrective high and new key risk parameter this contract must recoup to break the major downtrend.
On a smaller-degree scale we’re identifying 10-May’s 102.575 low as the end of a minor 1st-Wave down that the market would now be expected to sustain losses below to maintain the impulsive integrity of a smaller-degree 5-wave sequence down from 106.55. Per such we’re marking 102.60 as our new short-term risk parameter from which shorter-term traders can objectively rebase and manage the risk of a still-advised bearish policy and exposure.


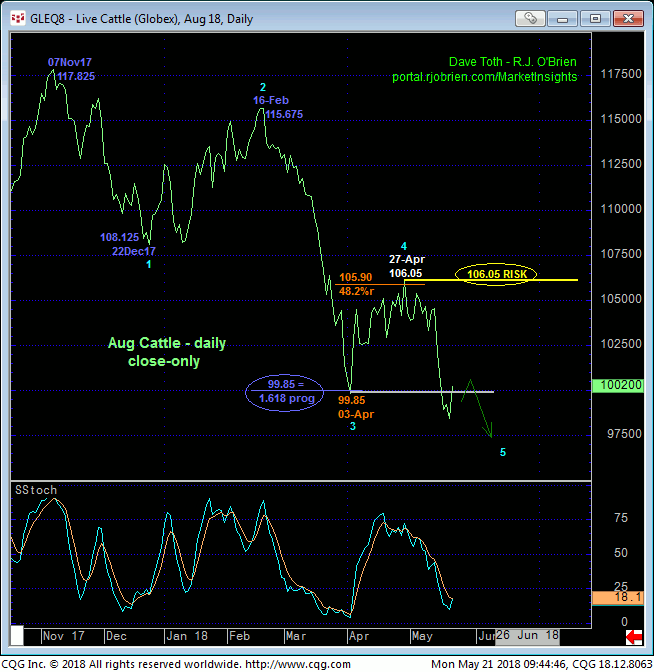
The daily close-only chart of the Aug contract above provides a textbook study of Elliott Wave and Fibonacci analysis. The suspected 3rd-Wave down from 16-Feb’s 115.675 high close spanned a length exactly 61.8% longer (i.e. 1.618 progression) than 07Nov – 22Dec17’s 117.825 – 108.125 1st-Wave decline that was followed by Apr’s 4th-Wave correction that came within six ticks of the (105.90) 38.2% retracement of the 115.675 – 99.85 3rd-Wave. These relationships would seem to reinforce the prospect that the decline from 27-Apr’s 106.05 high and new key risk parameters is the completing 5th-Wave of a 6-MONTH sequence dating from 07Nov17’s 117.825 high.
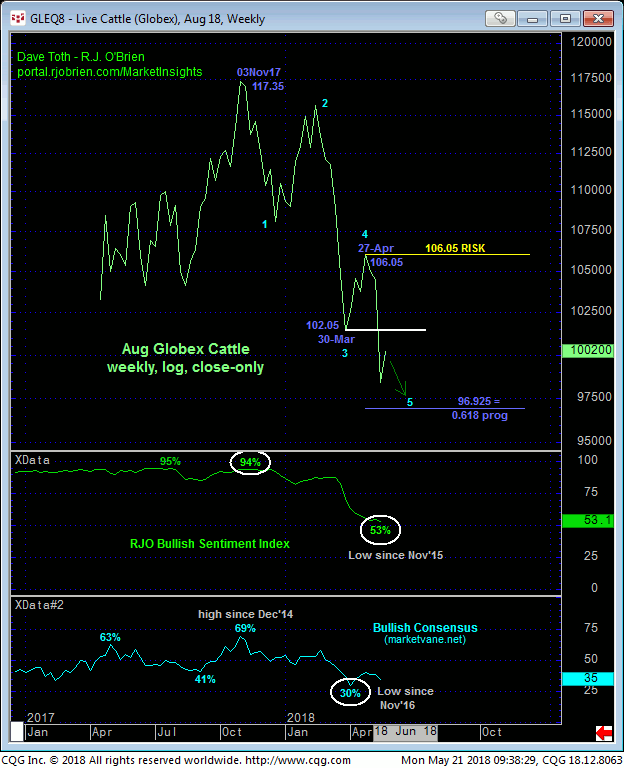
The prospect that the past few weeks’ resumed decline is the completing 5th-Wave of the decline from Nov’s high is clear in the weekly log close-only chart of the Aug contract below. And historically low levels in our contrary opinion sentiment numbers would seem to reinforce this eventual base/reversal-threat environment and count. HOWEVER, PROOF of “non-weakness” via a confirmed bullish divergence in momentum remains required to stem the clear and present downtrend and reject/define SOME level of support and more reliable low and risk parameter from which any non-bearish decisions like short-covers and cautious bullish punts could only then be objectively based and managed. Herein lies the importance of identifying risk levels like 102.60 and especially 106.55. And until such strength is proven, further and possibly accelerated losses should still not surprise.

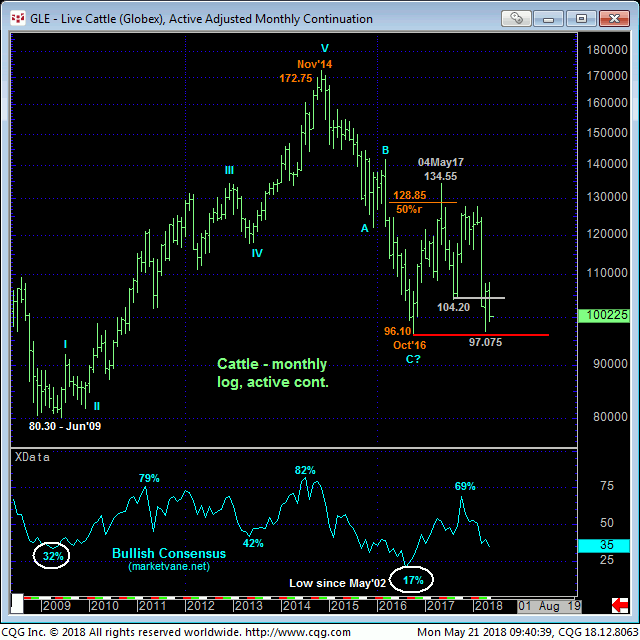
Finally, on an active-continuation chart basis, the weekly log chart above and monthly log chart below show the market’s proximity to the extreme lower recesses of the past couple YEARS’ range. If there’s a time and place for this downtrend to end, it’d be here and now, especially with the Managed Money community at its most bearish state since Nov 2015. But again, until and unless the market stems the downtrend with a confirmed bullish divergence in momentum, the trend remains down and should not surprise by its continuance or acceleration. Indeed, if the dominant 6-month downtrend breaks the 96-handle that has supported it since Oct’16, there is NOTHING to hold it up thereafter as a support candidate shy of 2009’s 80.30 low. This does not mean we’re forecasting a move to 80-cent. But it certainly does mean that the market’s downside potential below Oct’16’s 96.10 low is indeterminable and potentially severe.
In sum, a bearish policy and exposure remain advised with strength above 102.60 in the now-prompt Aug contract minimally required to threaten this call and warrant defensive action. In lieu of such strength today’s pop is advised to first be approached as another corrective selling opportunity ahead of an expected resumption of the bear to new and potentially significant lows below 98.10.


