This week the EIA Petroleum Status Report showed a slowdown in US oil production, with US stockpiles losing -3.6 million barrels. The EIA number has been all over the map in the last few weeks, with a large build of 5.8 million barrels last week, which leads me to believe the $60 to $70 range in crude prices is being arbitraged by the cash trade. US refineries were operating at 93.9% of their capacity, a 2.1% rise compared to last week, is the likely reason for the increased crude consumption. Refineries operating at near maximum capacity means the demand for WTI crude may be at highs. This will likely translate to lower crude consumption in the near term, and result in a bearish price scenario going forward.
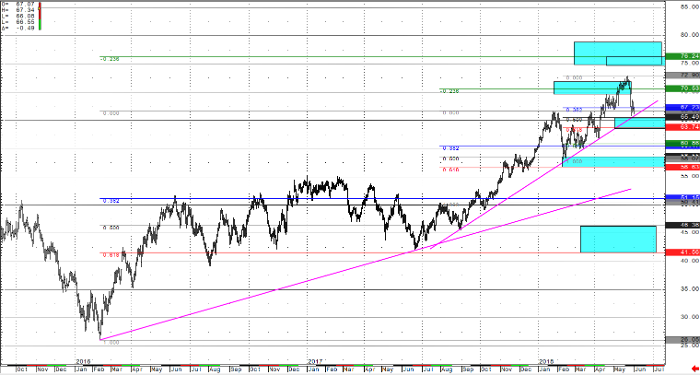
From a technical perspective, indicators which previously showed over bought conditions have been able to reset, with stochastics and momentum indicators tuning lower in this price drop over the last week. While a Fibonacci support zone has already provided a bounce from the $58.50 to $58.00 inflection zone (blue boxes on chart are Fibonacci inflection zones), WTI still have inflection zone targets clustered between $70 and $76 a barrel. The short term target from $58.00 (which is at $71) has been hit, and a pullback is often times the result of profit taking rather than the start of a reversal in trend. If WTI crude prices break back into the multiyear range (below $65), traders can expect support into the $63.80 and $58.00 inflection zones. Before this situation can even be considered, WTI crude price would need to settle below $65.00 a barrel. The current supportive inflection zone (Fibonacci 50% pullback from $58.07 low to $72.90 high) comes in at $65.49, which also aligns with trend line support drawn against lows (magenta lines).
In my opinion, the rally that has taken WTI crude prices above the $66.66 continuous contract highs (into the end of 2017 and start of 2018) is still at the forefront of traders’ minds. The fight over trend seems to be all but won by the bulls, which had been ruminating for most of the month of April. The recent pullback is currently testing the $66 prior highs (broken resistance) now being tested as support. Technical upside targets were hit, which has resulted in profit taking from the $70 to $73 inflection zone, and the market is pulling back into its next support. With WTI Crude prices above prior multi year highs, the trend is up until it’s not (and I like to think, trend is my friend). When a market speaks, you must listen, and WTI crude may be telling us this is the beginning of a much larger trend being born.
Crude Oil Daily Continuation Chart


