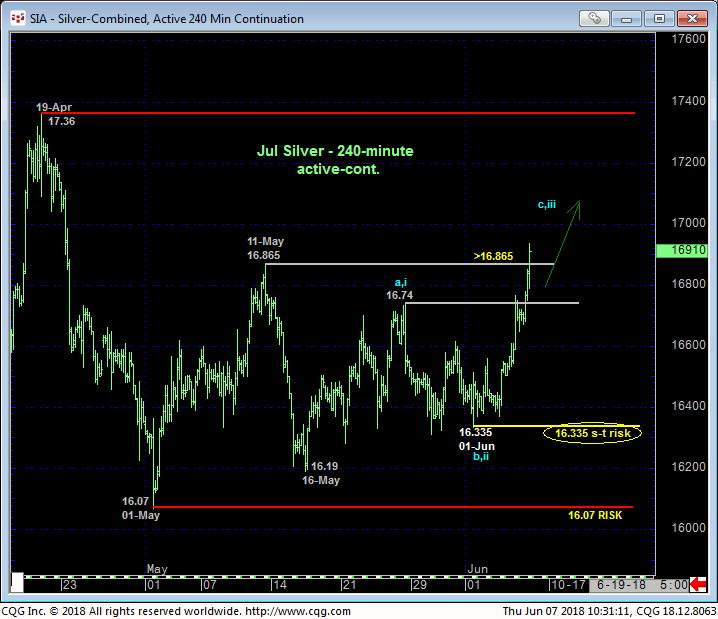
Fortunately or unfortunately, readers of our silver blog know that we’ve been mining for a major base/reversal now for MONTHS. Yesterday and today’s impulsive spike above the past MONTH’S worth of resistance ranging from 16.74 to 16.865 confirms at least the intermediate-term trend as up and leaves last Fri’s 16.335 low in its wake as THE latest smaller-degree corrective low and new short-term risk parameter this market is now minimally required to fail below to once again squelch a bullish policy.
The 240-min chart below also shows that this strength expose an area between spot and 19-Apr’s 17.36 high that’s totally devoid of any technical levels of merit. In effect, there is no resistance between spot and 17.36. This doesn’t mean we’re forecasting a move to 17.36. But it certainly does mean that until and unless this market stems the clear and present uptrend with a countering bearish divergence in momentum, ANY amount of upside is in play, including a run to or even through 17.36.


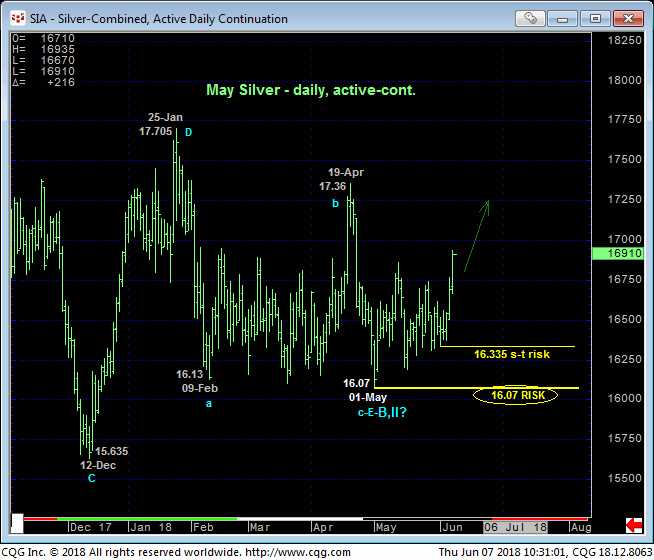
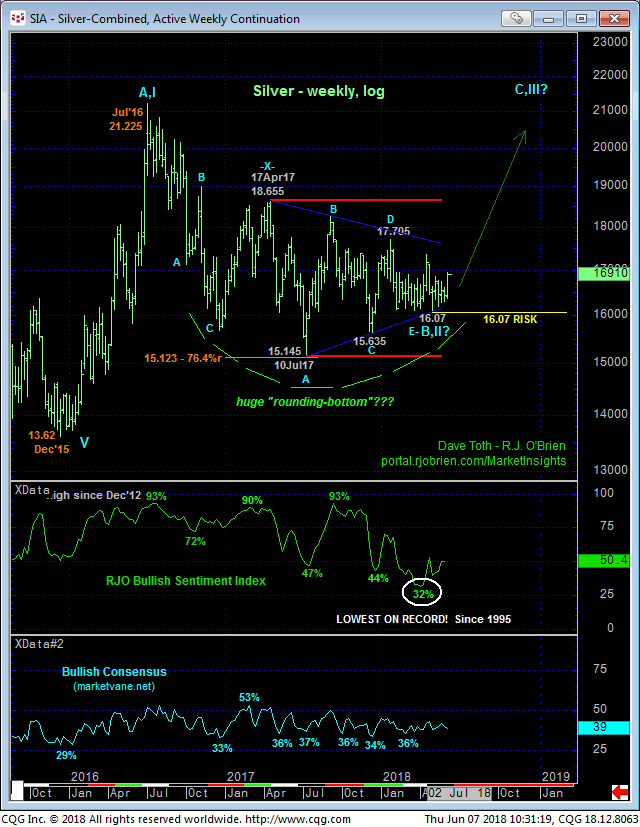
The daily chart above shows the this week’s resumption of a recovery that dates from 01-May’s 16.07 next larger-degree corrective low and our key long-term risk parameter to a bullish policy. Not only that, this incessant range dates back to 4Q16 as shown in the weekly log chart below, so continued aimless whipsaw risk and further bull-disappointment should hardly come as a surprise.
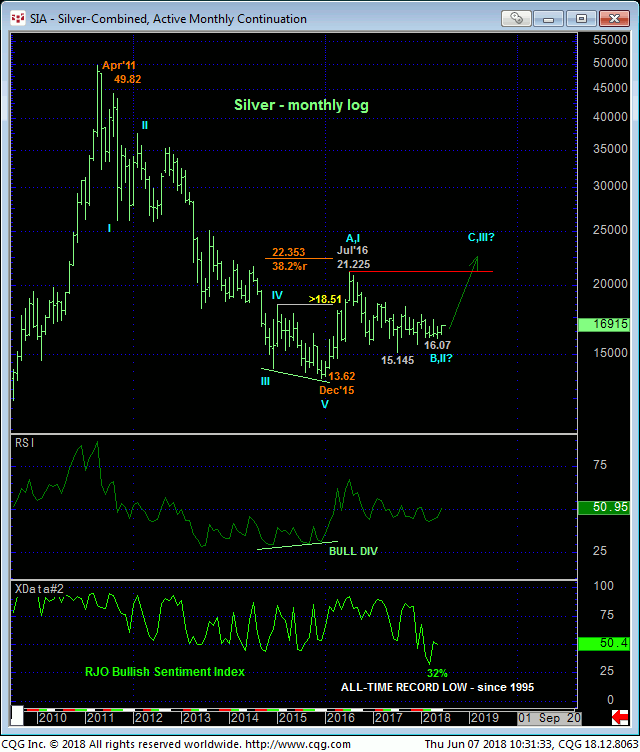
We would be remiss however is we failed to remind traders of the MAJOR, multi-year BASE/reversal environment that remains intact from Dec’15’s 13.62 END of the 4-YEAR secular bear trend from Apr’11’s 49.82 all-time high. Our bullish count contends that the relapse from Jul’16’s 21.225 high is”only a (B- or 2nd-Wave) correction” within a major base/reversal PROCESS that we believe will ultimately result in a resumption of 2016’s initial uptrend to levels above 21.225.
The past six quarters looks to be a huge “rounding-bottom” reversal pattern that, if correct, warns of an eventual extensive, impulsive rally similar to 2016s. Recent historically bearish sentiment- including a new all-time low of 32% in our RJO Bullish Sentiment Index- reinforces this long-term bullish count. Weakness below 01-May’s 16.07 low remains minimally required to even defer this bullish count, let alone threaten it.
Will this current intra-range pop be THE rally that explodes higher? There’s no way to know. But what we can state with specificity is that until or unless this market fails below at least 16.335, there is no way to know that this move ISN’T THAT move that, at some point, will become obvious. like the past week’s explosive move in copper.

Finally and once again, traders are reminded that the early-2016 rally, in fact, ended the 2011 – 2015 secular bear market at 13.62. As long as that 13.62 low remains intact, so too does our long-term base/reversal count calling for potentially huge gains above Jul’16’s 21.225 high shown in the monthly log chart below. And the past couple days’ admittedly intra-range but impulsive spike provides another round of shorter-term credentials from which a cautious bullish policy can be objectively based and managed.
These issues considered, traders are advised to first approach relapse attempts to former 16.75-area resistance-turned-support as corrective buying opportunities with a failure below 16.335 required to negate this call and warrant its cover. In lieu of such sub-16.335 weakness we anticipate further and possibly surprising gains straight away.


