Nearly two years ago in 22Jun16’s Technical Blog following similar price action to that we’ve seen over the past couple weeks we wrote:
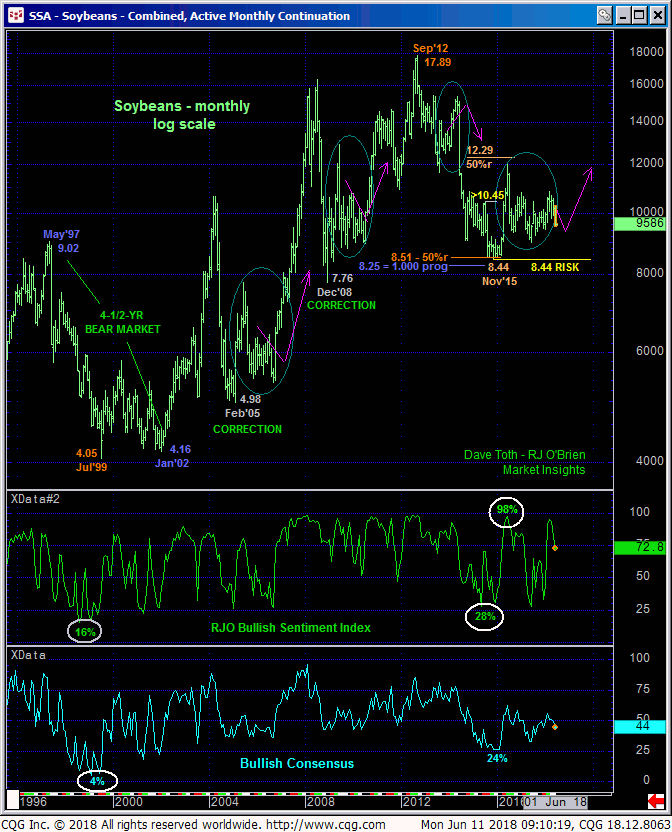
From an even longer-term perspective shown in the monthly log scale active-continuation chart below, we do not doubt that Nov’15’s 8.44 low COMPLETED the major bear market from Sep’12’s 17.89 all-time high. But as with three of the past four major turning points in this market circled below, initial counter-trend moves have been rebutted by corrections that were EXTENSIVE in terms of both price and time. By extensive, we mean retracements of at least 61.8% of that initial counter-trend move. In the weekly log scale chart of the Nov contract above, a 61.8% retrace of Sep’15 – Jun’16’s 8.50 to 11.85 rally cuts across at 9.65. But even more debilitating than a $1.50 decline is the length of TIME such a correction could take, perhaps months or even quarters. Combined with the peak/reversal threats discussed above, the market’s recovery to within 20-cents of the (12.29) 50% retrace of 2012-15’s 17.89 – 8.44 bear market could also be a contributing factor to a peak/reversal environment.
JUL18 SOYBEANS
Beginning with Mar’16’s bullish divergence in weekly momentum and still, the market has yet to negate our long term base/reversal count that contends that Nov’s 15’s 8.44 completed the secular bear trend from Sep’12’s 17.89 high and that the market has been in a major, multi-quarter/multi-year base/reversal process. Over this time we’ve discussed relatively shorter base/reversal processes like the approximate 24-month periods that followed the Dec’08 and Feb’05 lows and the THREE YEARS it really took for the bull to take hold following Jul’99’s 4.05 low.
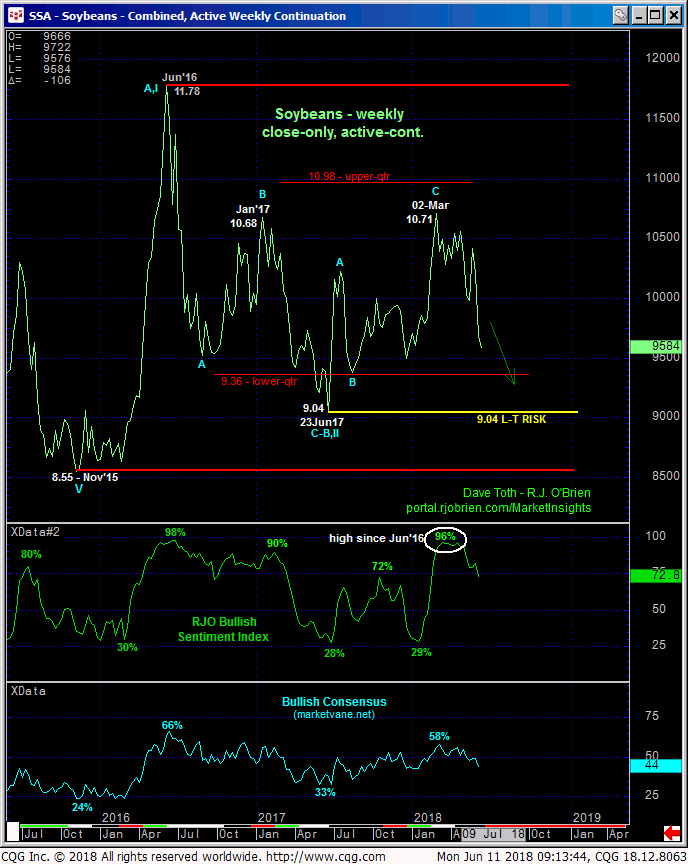
We’re currently 2-1/2-years removed from Nov’15’s 8.44 low. And given the extent and impulsiveness of the past week’s continued decline, we believe the market has reverted once again to the bowels of a 4-year range that may take weeks or even months to diffuse. From a long-term perspective however, a break below Nov’154’s 8.44 obviously key low remains required to negate this long-term base/reversal threat.


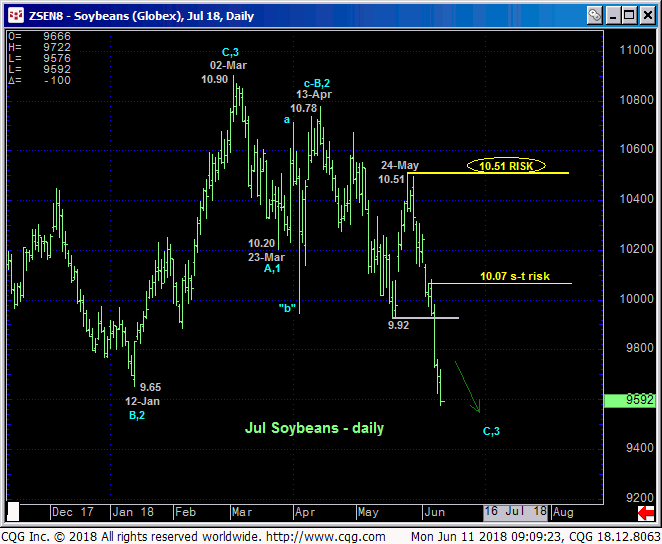
In the weekly close-only chart above, the extent of the current relapse renders the entire Jun’17 – Mar’18 recovery attempt a 3-wave affair as labeled. This exposes a run at or even through Jun’17’s 9.04 low and the lower-quarter of the multi-year range that has repelled all recent assaults. On a daily basis below the longer-trend trend is clearly down following the break of 17-May’s 9.92 low, defining 24-May’s 10.51 high as the latest larger-degree corrective high and new key risk parameter this market must now recoup to negate a bearish count and resurrect a long-term bullish one.

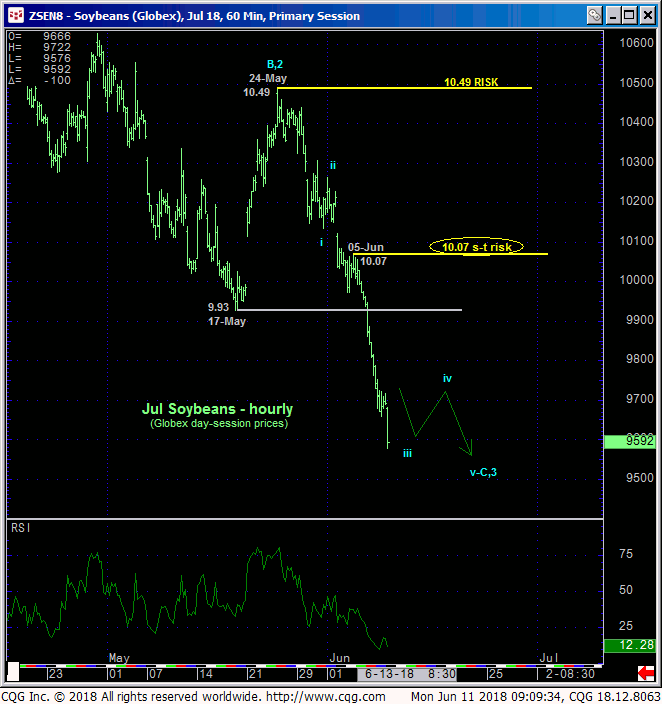
Drilling down to an intra-day basis, the hourly chart below shows ACCELERATING weakness with the latest smaller-degree corrective high defined by 05-Jun’s 10.07 high. Currently, this is our new and, admittedly, somewhat impractical short-term risk parameter for a still-advised bearish policy. As we strongly suspect this downtrend to “slow down” before it ends however, we believe it is very likely that this market will provide an interim corrective bear-flag structure and then resume the slide that will provide a much tighter but yet objective short-term parameter from which the risk of a bearish policy can be rebased and managed.
This hourly chart is the latest example of the ridiculousness of ever referring to a market as being “oversold”. Indeed, the merely derived momentum indicator “tail” never, ever wags the underlying market “dog”. Somewhere along the line this bear will recover and, accordingly, the momentum indicator will go up as well. But only after a recovery above a prior corrective high or an initial counter-trend high can one objectively conclude the downtrend has been broken AND that the market has identified a more reliable low and risk parameter from which non-bearish decisions like short-covers and cautious bullish punts can be considered objective acts.
These issues considered, a bearish policy remains advised with minimum strength above 10.07 required to threaten this call enough to warrant defensive measures. In lieu of such strength, further losses to or below the (9.35) lower-quarter of the 4-year range remain expected.


