JUL CORN
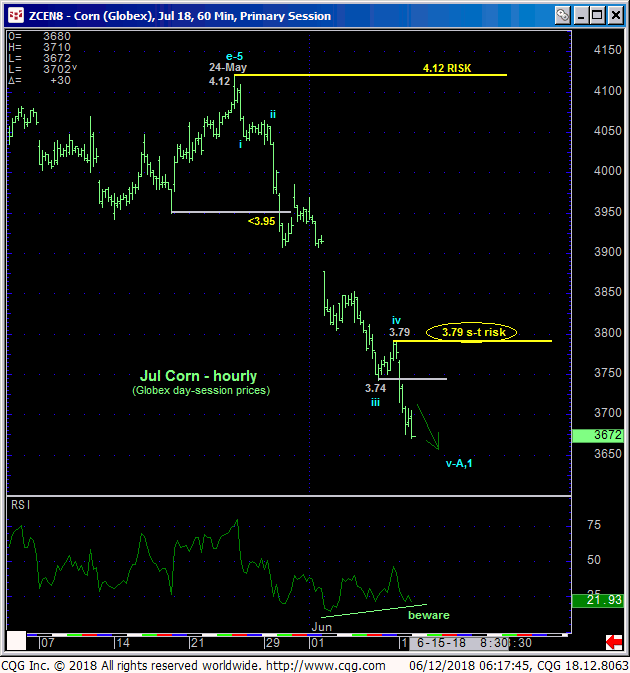
In Thur’s Technical Blog we advised tightening risk on an interim bearish policy as the market reverts to the middle-half bowels of a near-4-year range where we believe the odds of aimless whipsaw risk rise. Following yesterday’s continued slide below Thur’s 3.74 low, the hourly chart below shows that the market has identified Fri’s 3.79 high as the latest smaller-degree corrective high it must sustain losses below to maintain a more immediate bearish count. Its failure to do so will confirm a bullish divergence in short-term momentum, stem the slide and expose at least an interim corrective rebound that, given the extent and fairly uninterrupted nature of the recent swoon, could be nominally significant. Per such we are considering that 3.79 high as our new short-term but important risk parameter from which one can objectively rebase and manage the risk of our bearish count introduced in 30-May’s Technical Blog.


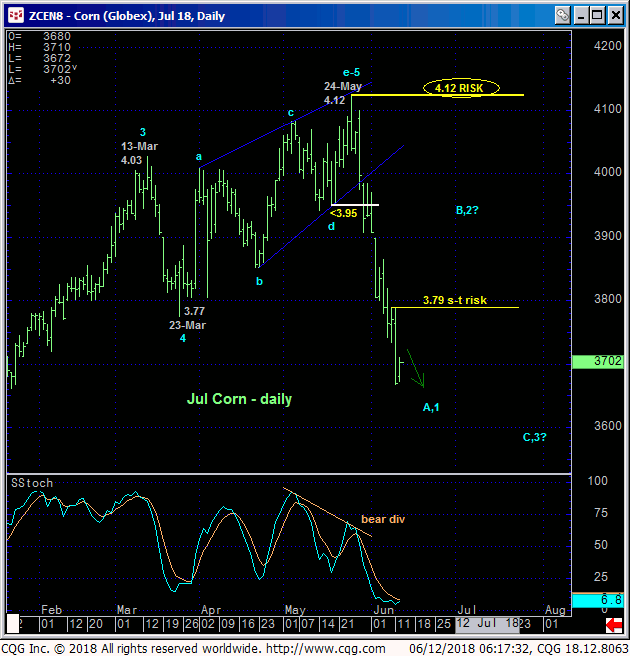
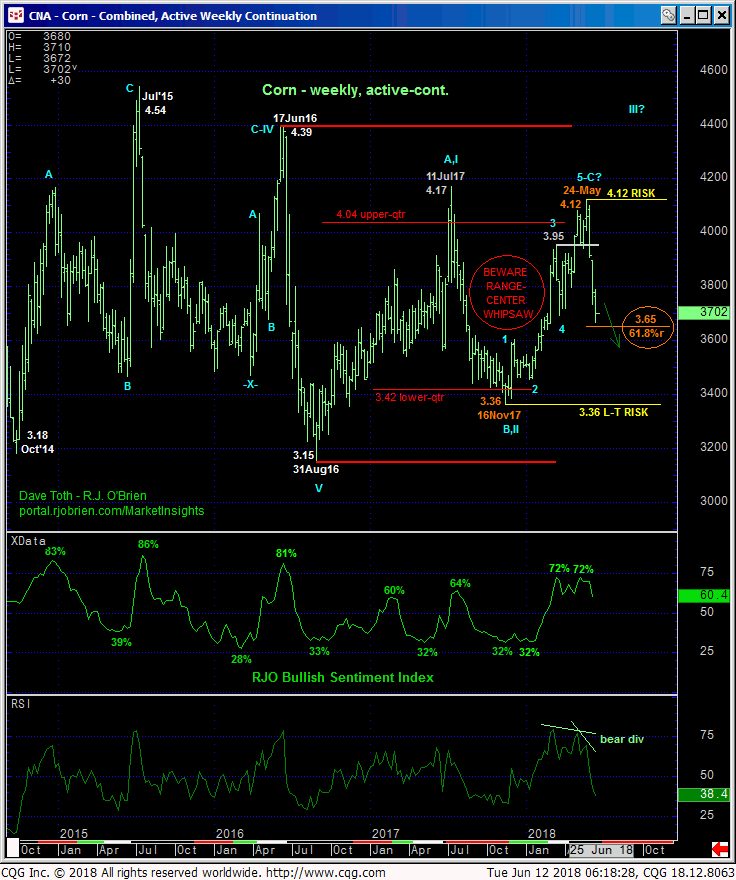
As trendy and beautiful and easy-to-navigate as the past three weeks’ decline has been on a daily basis above, that’s how heinously choppy, challenging and frustrating the past 4-YEAR lateral range has been on a much broader weekly active-continuation basis below. We continue to maintain that this price action dating even back to Oct’14’s 3.18 low is that of a major BASE/reversal event that will produce levels above 4.50 before the market breaks Aug’16’s 3.15 low. But as a result of:
• the recent bearish divergences in both daily and weekly momentum
• the market’s rejection once again of the upper-quarter of the 4-year range amidst
• historically frothy levels in our RJO Bullish Sentiment Index and
• a complete 5-wave Elliott sequence up from Nov’17’s 3.36 low
we may be in store for the same type of 3Q and 4Q price action as that that followed each of the past three summers’ peak/reversals that could delay our base/long-term-bullish count for another crop year.
Getting back to the tightening bear risk however, we always approach range-center environments with a more conservative approach to risk assumption given what we know are greater odds of aimless whipsaw risk and directional trade losses. And indeed, the recent slide has put the market in the dead-center of this massive lateral range. The past couple weeks’ uninterrupted slide has been a joy to navigate. The market’s failure to sustain the past couple days’ losses below 3.79 could end that and expose a period of heinous, difficult-to-manage chop that we believe will have increased odds of losing trading decisions.
These issues considered, a bearish policy and exposure remain OK with a recovery above 3.79 deferring or threatening this call enough to warrant moving to a neutral/sideline position in order to circumvent the heights unknown of what we believe would likely be an interim corrective pop before a resumption of the May-Jun downtrend to, potentially, the lower-quarter of the long-term range around 3.40 or lower. In lieu of such 3.79+ strength however, further and possibly accelerated losses should not surprise.


