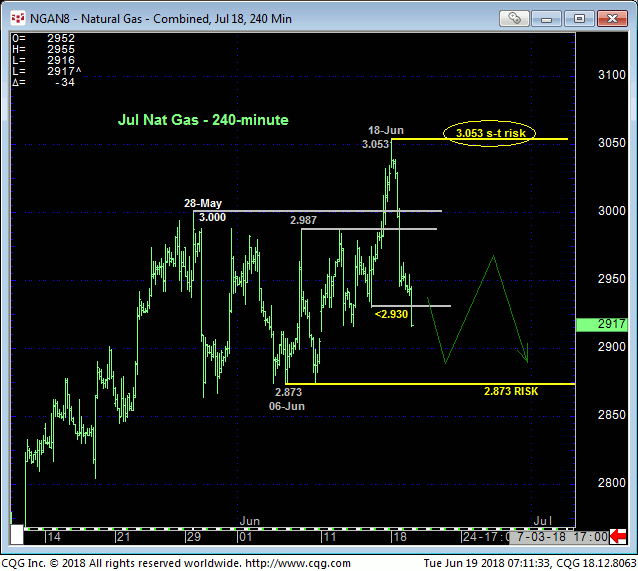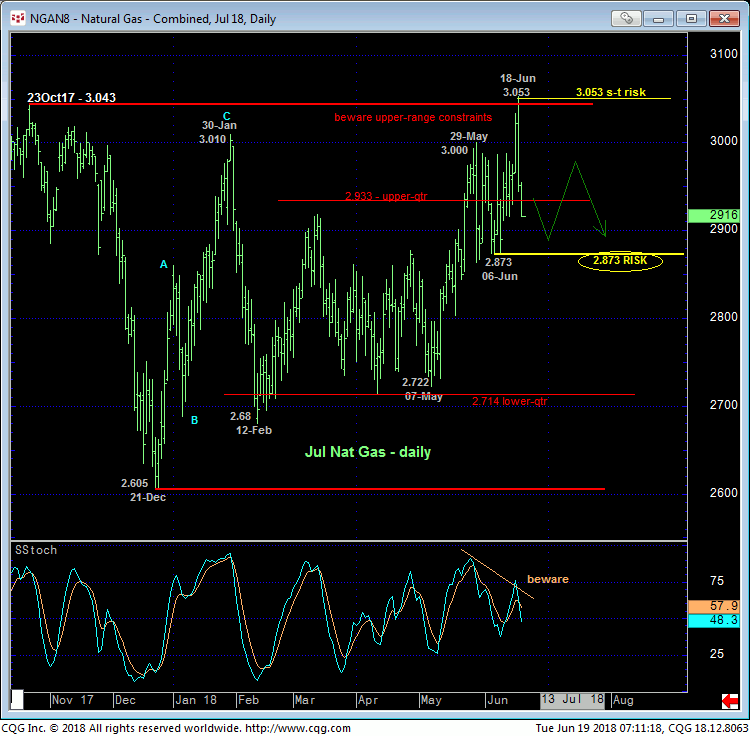
The market’s failure this morning to sustain Fri and yesterday’s “breakout” above months of resistance ranging from late-May’s 3.000-area highs to 23Oct17’s 3.043 high and relapse below our 2.930 short-term risk parameter discussed in Fri’s Technical Blog jeopardizes the impulsive integrity of a more immediate bullish count. This weakness leaves Fri’s 3.053 high in its wake as one of developing importance and possibly the start of another relapse within a major incessant range. Per such traders are advised to consider that 3.053 high as our new short-term risk parameter from which non-bullish decisions like long-covers and cautious bearish punts can be objectively based and managed.


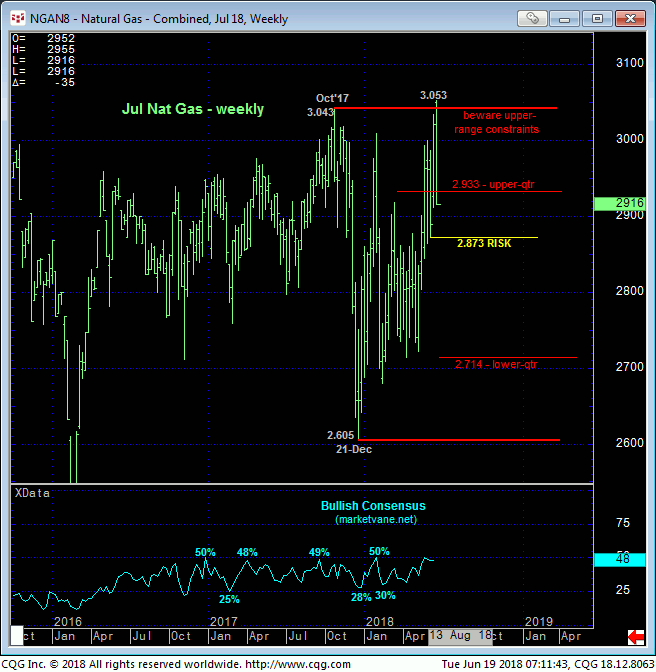
Commensurately larger-degree weakness below our longer-term risk parameter defined by 06-Jun’s 2.873 larger-degree corrective low remains required to confirm the bullish divergence in momentum on a daily scale (above) to, in fact, break the major but intra-range uptrend from at least 07-May’s 2.722 low and possibly from as far back as 12-Feb’s 2.680 low. The fact that this morning admittedly smaller-degree weakness stems from THE extreme upper recesses of a massive, historic range should not only not come as a surprise to anyone, but should also be taken as a warning of another relatively severe intra-range relapse to its lower-quarter around 2.70. Relatively frothy market sentiment, indicated by the Bullish Consensus (marketvane.net) in the weekly chart of the Jul contract below, would seem to reinforce this broader peak/reversal-threat environment.
These issues considered, both short and longer-term traders are advised to neutralize any recently recommended cautious bullish exposure and move to a neutral/sideline position. Furthermore, we will approach recovery attempts to the 2.980-area OB as corrective selling opportunities with a recovery above 3.053 required to negate this call. A multi-week or even multi-month move to the lower-half or lower-quarter of the 2-year range is expected until and unless the market recoups Fri’s 3.053 high.


