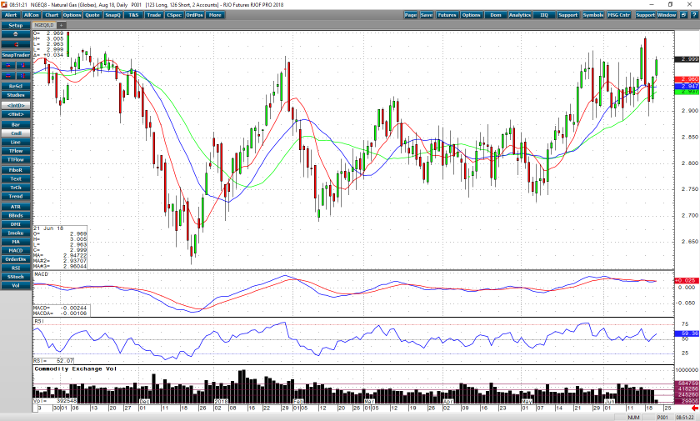
The trend in August natural gas is languishing in a range between 2.900 and 3.000, even though the last two days have been up. Resistance seems to be hitting now as 2.990 is the nearby resistance. The close in support appears to be today’s low at 2.960. Closing prices below may signal selloffs but, I doubt it. A close above 3.000 should take the range a little higher from 3.000 to 3.050. Momentum studies are trending a bit higher but are still locked in the middle of the trading ranges, not helping or hurting the market in either direction. Higher than normal temps are forecast in the coming week. An 85 bcf injection is anticipated today. This is right in line with the 5-year average which at 83 bcf is almost the estimated rate.
The forecasted above average highs are lending a bit of support to the August natural gas. The next 14 days should be slightly above average after below seasonal highs in Chicago this week. The next days beyond the weekend should help determine the direction of the market. I expect more range trading below 3.050, and a selloff to 2.960.
Natural Gas Aug ’18 Daily Chart


