AUG GOLD
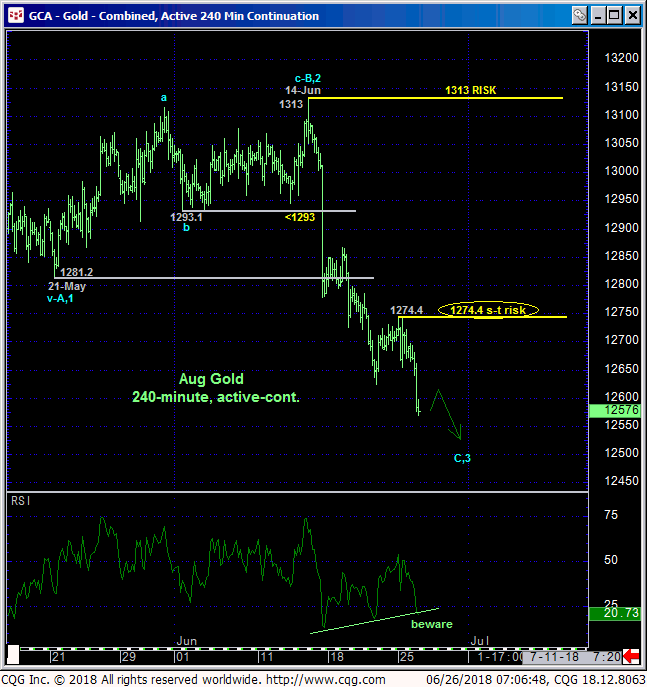
Overnight’s break to yet another round of new lows leaves yesterday’s 1274.4 high in its wake as the latest smaller-degree corrective high and new short-term risk parameter this market is now minimally required to recoup to even defer, let alone threaten the past 2-1/2-month downtrend. In lieu of such strength further and possibly accelerated losses should not surprise,.
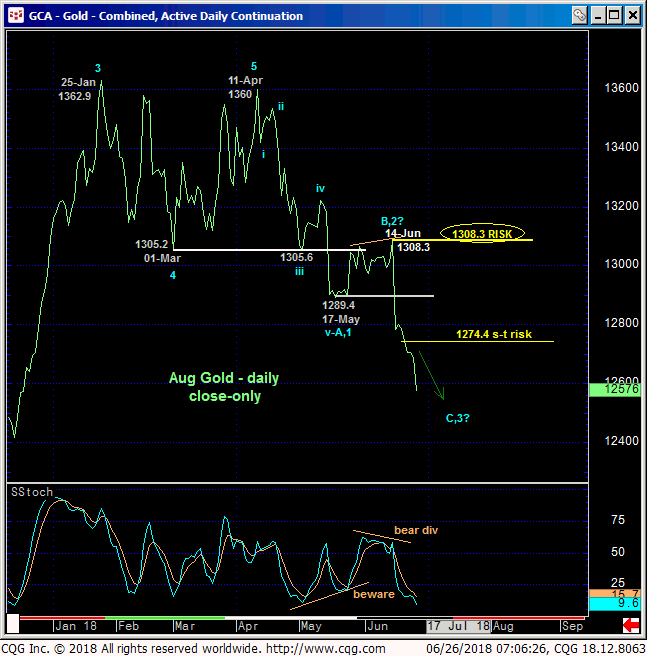
Only a glance at the daily close-only chart above is needed to see that the trend remains down on any practical scale. The weekly log scale chart below shows the market encroaching on 12Dec17’s 1238.3 low and neighboring (1241) 50% retrace of Dec’16 – Apr’18’s entire 1124.3 – 1369.4 rally amidst the deterioration of market sentiment levels to those that have warned of and accompanied key correction lows and reversals the past year-and-a-half. These factors warn us to be watchful for even an admittedly shorter-term momentum failure that could produce surprising gains thereafter.
This said, a break below Dec’17’s 1238.3 low leaves the market vulnerable to what could be steep, protracted losses to the lower-quarter of the past couple years’ range, so traders are urged not to underestimate this intra-range bear’s downside potential.
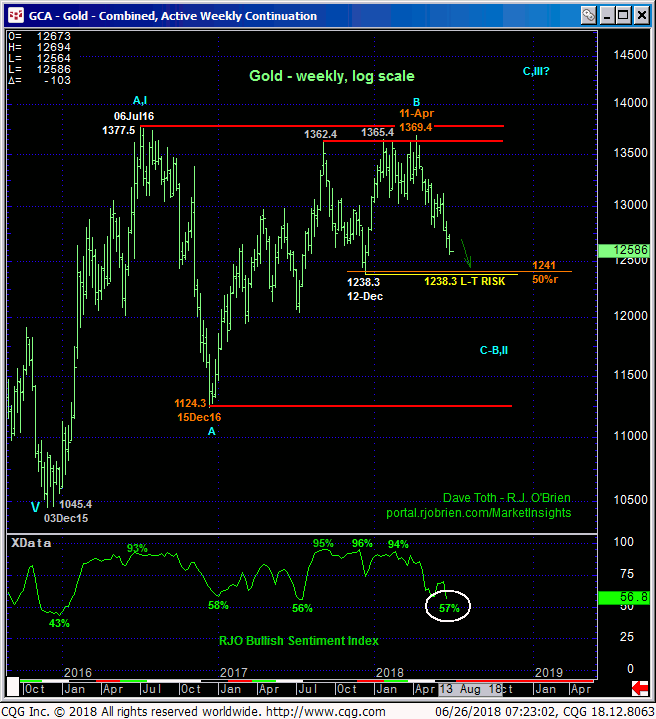
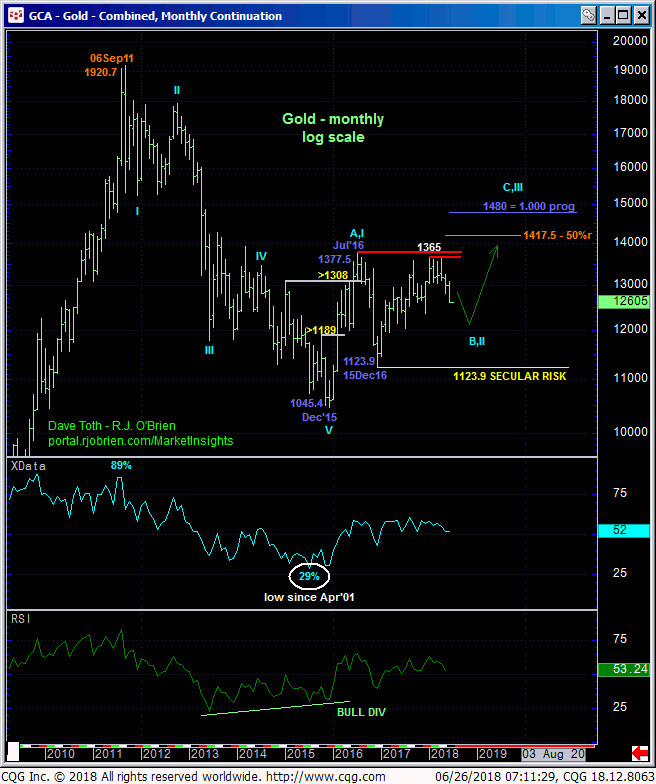
From an even longer-term perspective however, we continue to maintain the bullish prospect that early-2016’s rally from 1045 to 1377 broke the secular bear trend and defines just the INITIAL A- or 1st-Wave of a major correction or reversal higher that will ultimately produce major gains above 1377. The price action from Jul’16’s 1377 high is consider the B- or 2nd-Wave correction within this major, multi-quarter base/reversal PROCESS.
These issues considered, a bearish policy remains advised with strength above 1274.4 required for shorter-term traders to move to the sidelines. Commensurately larger-degree strength above 14-Jun’s 1308.3 larger-degree corrective high close is required for longer-term players to take similar defensive action. In lieu of such strength, further and possibly accelerated losses should not surprise.
SEP COPPER
Similarly, yesterday’s continued decline in the now-prompt Sep Copper contract detailed in the 240-min chart below leaves yesterday’s 3.0450 high in its wake as the latest smaller-degree corrective high the market is now required to sustain losses below to avoid confirming a downtrend-ending bullish divergence in momentum. Per such, 3.0450 becomes our new short-term risk parameter to a still-advised bearish policy.
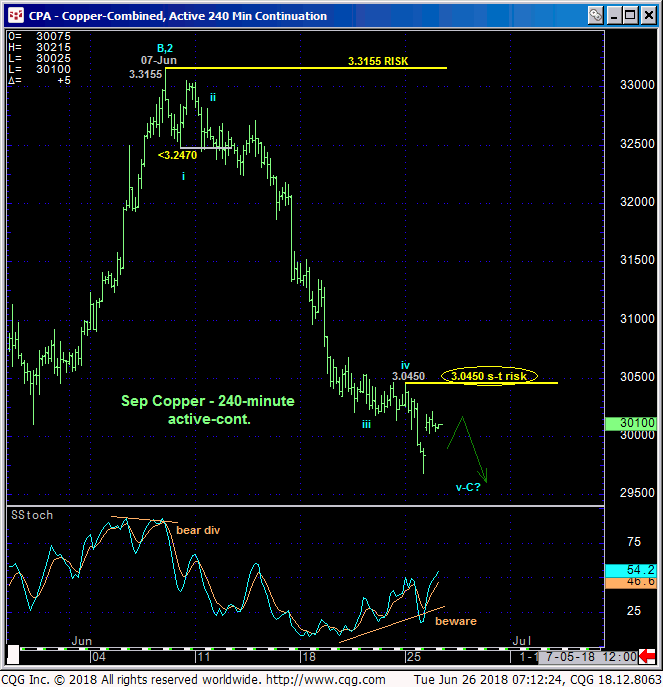
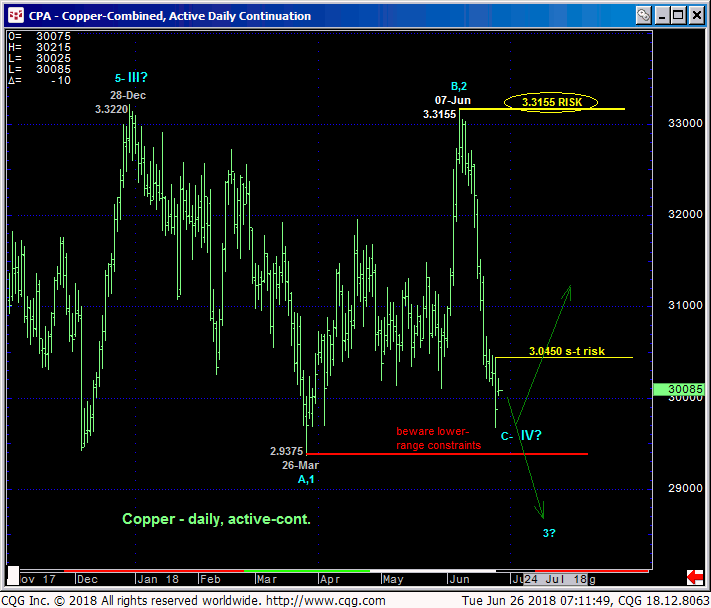
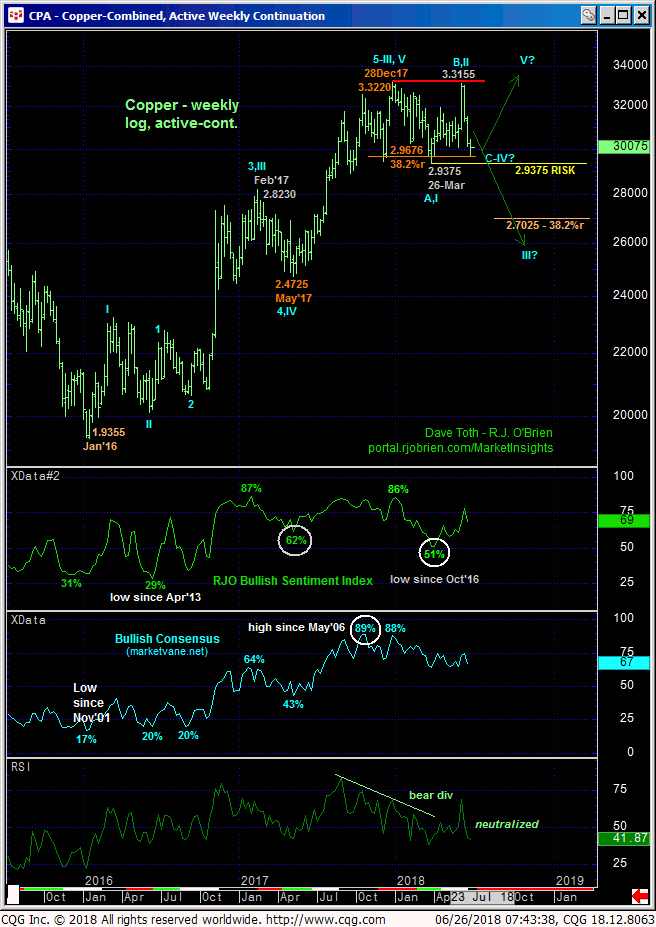
This tight but objective risk parameter may come in handy as the market engages the extreme lower recesses of the range that has constrained and dominated prices since 28Dec17’s 3.3220 high shown in the daily (above) and weekly log (below) charts. If there’s a time and place for this market to turn back up, it is here and now, and an admittedly short-term mo failure above 3.0450 would be the very first indication of such.
By the same token, a break of 26-Mar’s obviously pivotal 2.9375 low and our long-term risk parameter exposes a PEAK/reversal count that could be absolutely major in scope. Such sub-2.9375 weakness exposes a wave count that suggests Dec’17’s 3.3220 high COMPLETED a major 5-wave Elliott sequence from Jan’16’s 1.9355 low, exposing months or even quarters of correction/reversal where even a Fibonacci minimum 38.2% retrace doesn’t cut across until the 2.70-area.
These issues considered, a cautious bearish policy remains advised with a recovery above 3.0450 required to threaten this call enough to warrant moving to a neutral/sideline position. A break below 2.9375 could expose steep, relentless losses and warrants more aggressive bearish participation with a recovery above 3.0450 required to negate that call and warrant its cover.
