NOV SOYBEANS
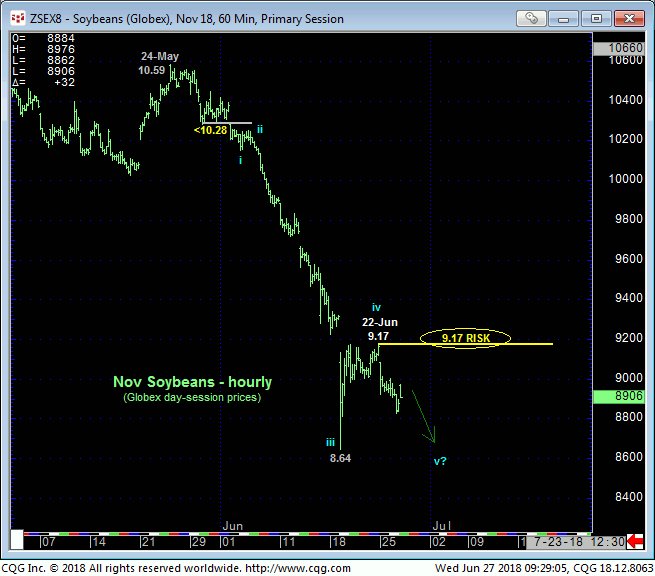
In 19-Jun’s Technical Blog we discussed we discussed the likelihood of the late-May/Jun collapse “slowing down” before ultimately bottoming. Such slowdown processes take the form of an interim corrective hiccup and at least another round of new lows that the market fails to hold. In this vein we’d like to direct traders’ attention to Fri’s 9.17 high detailed in the hourly chart below. While the bear has yet to resume below 19-Jun’s arguably “rogue” low of 8.64, we have reason to believe that even this extraordinarily “tight” high at 9.17 can serve as a very effective and objective level from which to rebase and manage the risk of a still-advised bearish policy.
As always, the benefit of such a tighter risk parameter has to come in exchange for something, and that exchange is whipsaw risk. But given the market’s quick, emotional collapse to the lower-quarter of the past FOUR YEAR range that has repelled EVERY attempt at it since 4Q15, traders are advised to err on the side of a more conservative approach to (bear) risk assumption and prefer whipsaw risk to higher nominal risk. Indeed, given the extent and uninterrupted nature of the first-half of Jun’s meltdown, the market left NO levels of any technical merit between Fri’s 9.17 high and former 10.02-area support-turned-resistance from mid-May.


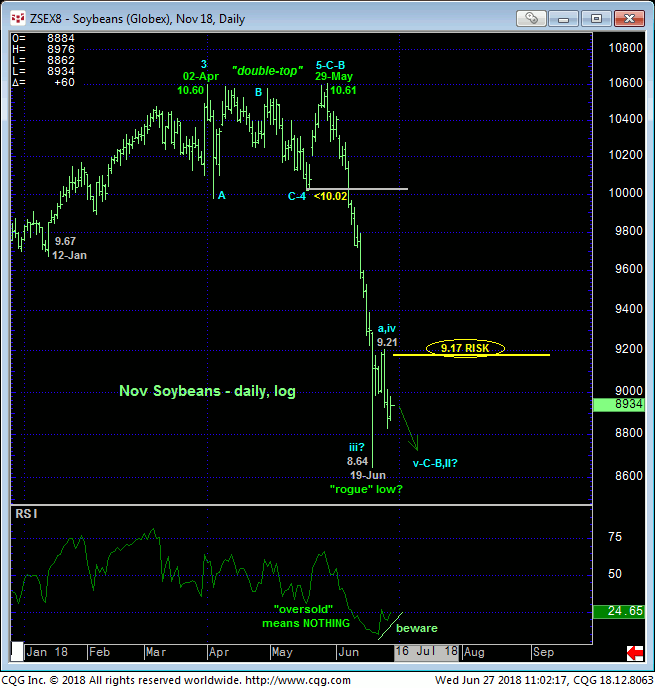
The daily log scale chart above shows last week’s plunge to a “rogue” low at 8.64. Under such circumstances the merits of such a low are easily questioned, as opposed to perhaps a more thorough reflection of price action like the daily close-only chart below. For in this close-only perspective the bear survived a corrective recovery attempt and achieved another new low close that 1) could be the completing 5th-Wave of the decline from 25-May’s 10.53 high and, more importantly, 2) creates the POTENTIAL for a bullish divergence in momentum. This potential will be considered CONFIRMED to the point of non-bearish action like short-covers and cautious bullish punts the momentum the market closes above Fri’s 9.18 close. Fri’s intra-day high was 9.17.
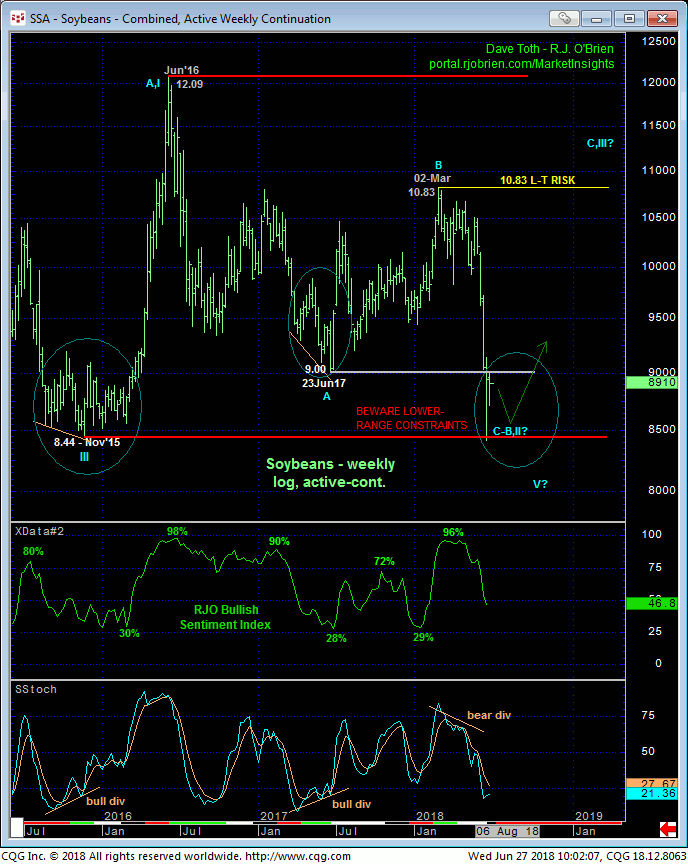
THE KEY reason we advise a more conservative approach to risk assumption “down here” is that the market has very quickly dumped down to the lower-quarter of the range that has arguably dominated price action since Sep’14. If there’s a time and place for the market to arrest the current major slide and expose another extensive intra-range rebound, it is here and now. And Fri’s key crop reports are easily seen as the catalysts to fuel a big move (either way).
Another development that would support a broader base/reversal count is the not unexpected capitulation of bullish exposure by the Managed Money contingent as indicated by our RJO Bullish Sentiment Index. To be sure, at a mere 47% currently, this market could continue to collapse. But if/when the market fails to sustain losses below a corrective high like 9.17, and given the importance of the extreme lower-recesses of a 4-YEAR range, we don;t want to underestimate the extent to which it might now be vulnerable to recovering.

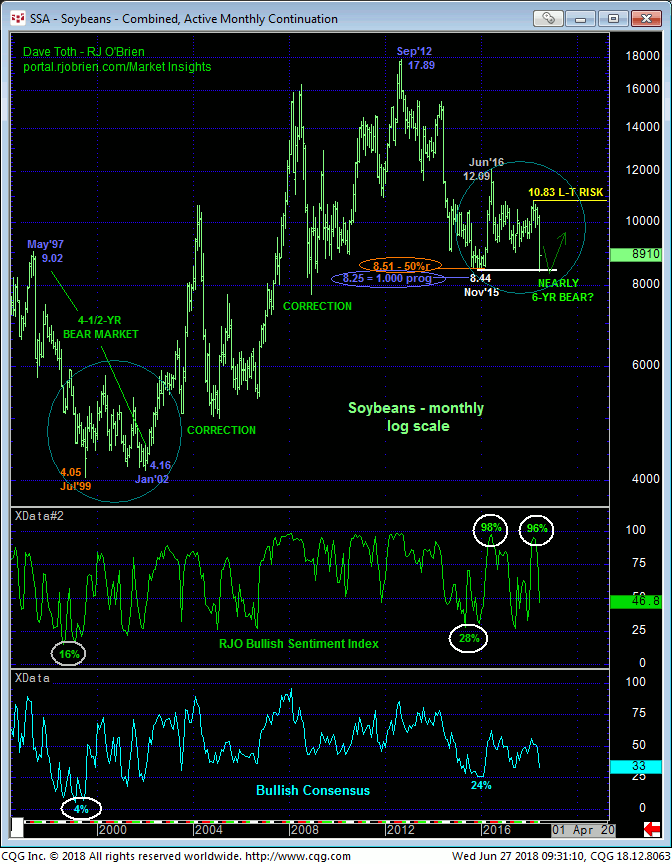
Finally and once again, from a very long-term historical perspective, the monthly log scale charts above and below show the importance of the area around Nov’15’s 8.44 low and Feb’16’s 8.61 low monthly close. That 8.61 low monthly close was the EXACT 61.8% retrace of the entire secular bull market from Dec’01’s 4.22 low to Aug’12’s 17.57 high! Additionally, the decline from Sep’12’s 17.89 all-time high has spanned virtually an identical length to ALL THREE previous major sell-offs: the 1997 – 2002 bear market, 2004-05’s correction and 2008’s correction.
The May’97 – Jan’04 secular bear market spanned 4-1/2 years. As a result of this month’s rogue spike, the current bear market from Sep’12’s 17.89 high has spanned nearly six years and has come within a pittance of 16-cents of equaling (i.e. 1.000 progression) the 1997 – 2002 bear in length on a log scale. The bottom line is that there has been and remains tons of technical “stuff” around the Nov’15 low of 8.44 that, combined with a confirmed bullish divergence in momentum needed to stem the clear and present downtrend, could expose an outstanding and long-term risk/reward buying opportunity. And herein lies are focus on MOMENTUM in the weeks and perhaps even days ahead.
These issues considered, a bearish policy remains advised with a recovery above 9.17 threatening this call sufficiently to warrant moving to a neutral/sideline position and circumvent the heights unknown of another correction or possibly major reversal higher. In lieu of at least such 9.17+ strength, further and possibly accelerated losses should not surprise.


