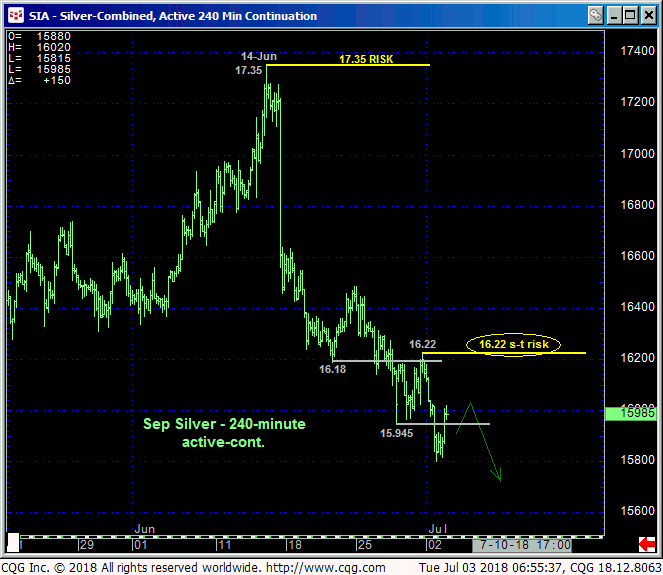
Yesterday’s break below last week’s support around 15.945-to-15.965 reaffirms the developing downtrend and leaves Fri’s 16.22 high in its wake as the latest smaller-degree corrective high the market is now minimally required to recoup to stem the slide, confirm a bullish divergence in momentum and expose a base/reversal-threat environment. Per such this 16.22 level is considered our new short-term risk parameter from which traders can objectively rebase and manage the risk of an interim bearish policy.

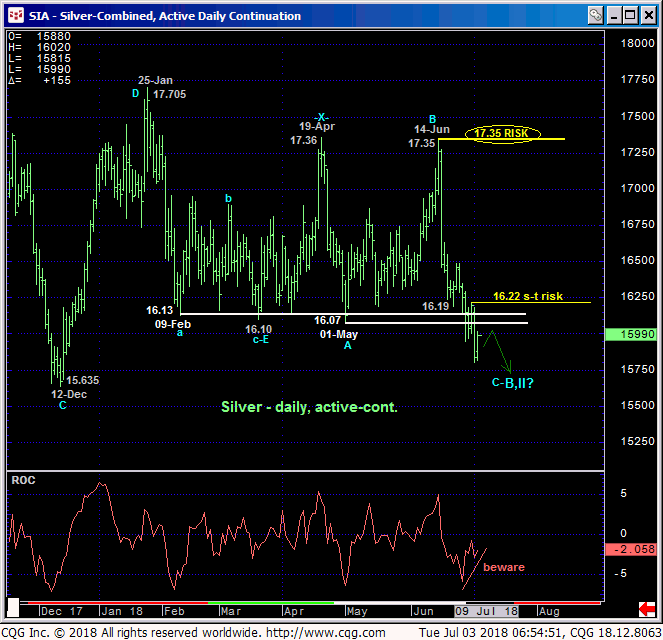
The thing that jumps off the daily chart below is the past week’s break below a TON of now-former support from the 16.07-to-16.13-range that now SHOULD hold as huge new resistance per any broader bearish count. If the market has something much more bearish in store for us, it should not only easily sustain sub-16.13-area levels, but it should continue lower in an increasingly trendy, impulsive and obvious manner.
This chart also shows the developing POTENTIAL for a bullish divergence in the rate-of-change measure of momentum. This current warning will be considered CONFIRMED to the point of non-bearish action like short-covers if/when it proves strength above 16.22. In lieu of such specific 16.22+ strength, further and possibly accelerated losses should not surprise.

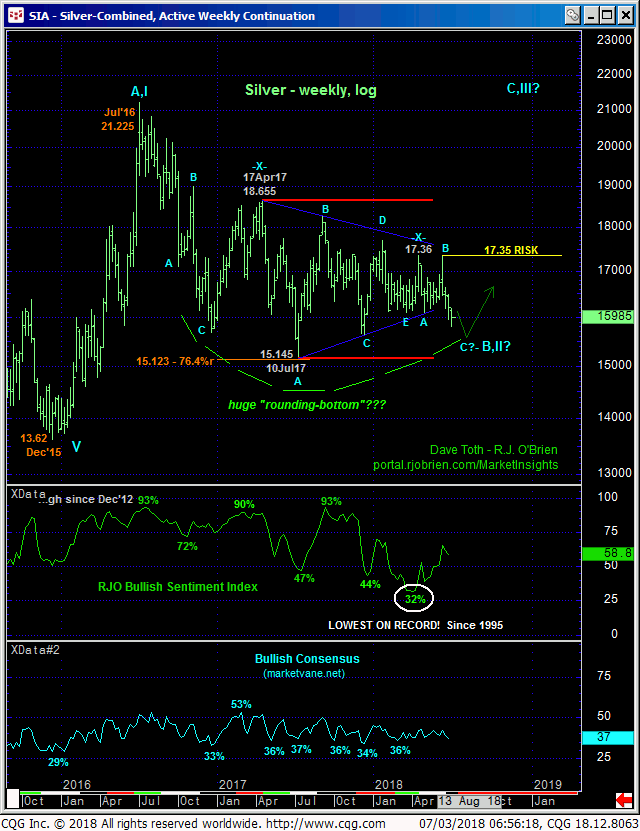
The importance of this tight but objective risk parameter at 16.22 can also be seen in this very long-term weekly log scale chart below where traders are reminded of what still could be a massive multi-quarter BASE/reversal process dating all the way back to Dec’15’s 13.62 low. Indeed and as we’ve discussed many times over the past two years, the extent and impulsiveness of the Dec’15 – Jul’16 rally broke the secular bear trend and exposes a major correction or reversal HIGHER. On this scale the price action from Jul’16’s 21.225 high is still considered a (B- or 2nd-Wave) correction ahead of an eventual resumption of the early-2016 rally to 21.225+ levels. What remains in question is where/when this correction ended or is going to end.
What we know as facts are:
- a break below Dec’15’s 13.62 low remains required to negate this count and
- 14-Jun’s 17.35 high remains intact as THE key risk parameter the market needs to recoup to reinforce this long-term bullish count.
It’s also pretty obvious that at least the intermediate-term trend is down until and unless the market recovers above 16.22.
These issues considered, a cautious bearish policy remains advised with strength above 16.22 required to threaten this call enough to warrant its cover ahead of what then could be a terrific risk/reward opportunity from the bull side. In lieu of such 16.22+ strength further and possibly accelerated losses are expected with former 16.07-to-16.13-area support considered new near-term resistance.


