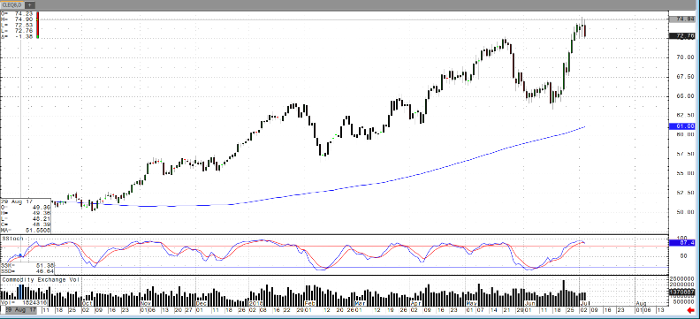
As of Thursday afternoon, the August crude oil contract has traded from a high of $74.90 per barrel to the current lows as of this writing near $72.55. While there are a number of bullish factors such as dissention among OPEC, bottlenecks in the U.S., and lost production in a number of areas; the headline number for today’s holiday delayed EIA number was the build in inventories of 1.2 million barrels.
Following the build in inventories, which does coincide with reports of supply bottlenecks and high refinery capacity rates, the market looks to be trading towards a close forming a possible reversal on the daily chart pictured below. This could also be a pause in a longer-term flag higher, and we should note this comes ahead of the looming deadline for tariffs.
While the longer-term trend for oil has been upwards as of this year, for traders with a shorter time frame or looking at the short side of the market, it is also interesting to note some of the calendar and Brent WTI spreads as well. One may also note the market tends to run up prior to a crowded long fund trade, something time will tell with tomorrow’s Commitment of Traders report.
Crude Oil Aug ’18 Daily Chart


