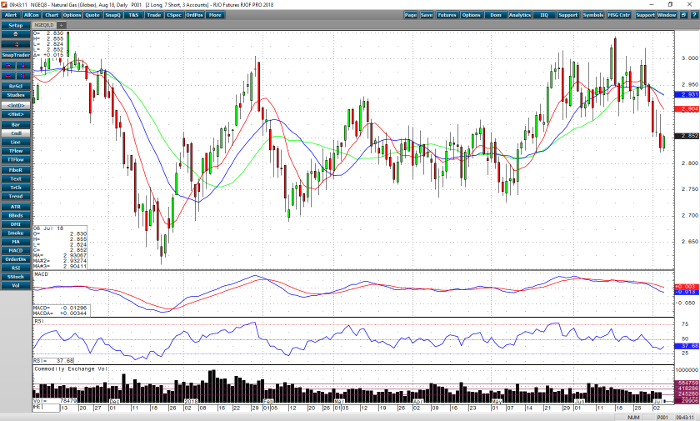
The trend for August natural gas is decidedly down. The past few days have had lower highs and lower lows on a daily chart. The injection today is above expected average, but well below the 5-year average and last year’s. An Injection of 76 bcf is expected, the average drawdown is 70 bcf. The shift in weather patterns has gone from above average to average temperatures in the next few weeks. The central US is experiencing a well deserved cool down. The weather pattern seems to favor the dry side going into the next 7-10-day period.
The trading prices have broken through to a lower range and are trending lower. The current price is trending lower and a bottom number is seen close to 2.750. Resistance is at 2.870 and will take a $2.900 print to change the trend. Between here and $2.840 and 2.750 will determine the following range. The averages and momentum studies are both turning down. Exposure to the short side is recommended until the next EIA number.
Natural Gas Aug ’18 Daily Chart


