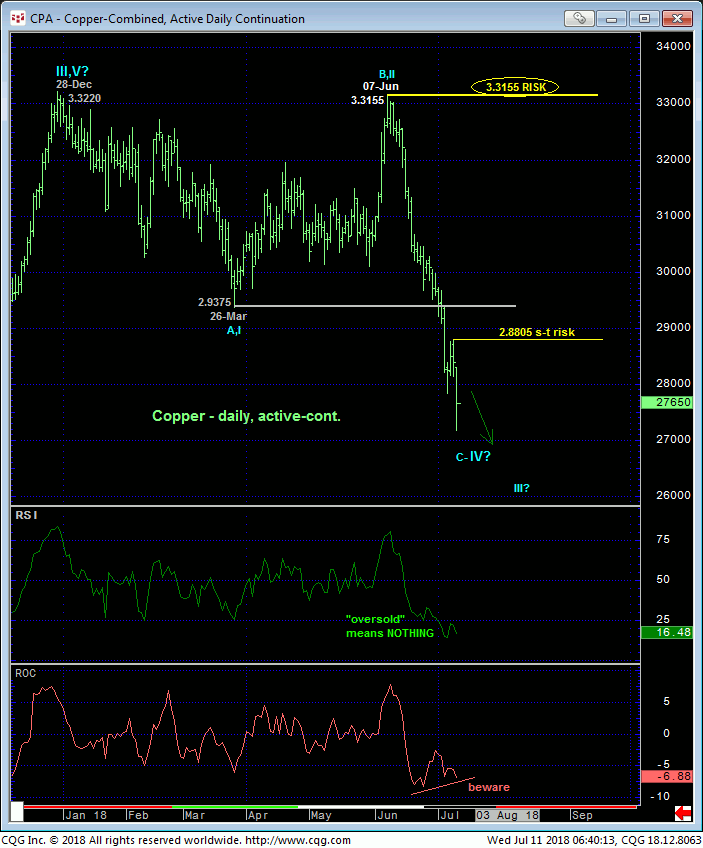
Today’s resumed downtrend below Fri’s 2.7825 low reaffirms the developing bear trend and leaves yesterday’s 2.8805 low in its wake as the latest smaller-degree corrective high this market is now minimally required to recoup to confirm a bullish divergence in momentum in the rate-of-change measure of momentum, stem the slide and expose even an interim corrective hiccup higher. In lieu of at least such 2.8805+ strength the trend is down on all scales and should not surprise by its continuance or acceleration.
The RSI measure of momentum shown in the daily chart above provides the latest example of the gross uselessness and erroneous of referring to a market as “oversold”. Despite almost constant examples that clearly show how errant such “oversold” (and “overbought”) references are, the use of these terms remains rampant in the commodity and equity markets. All such references should be totally ignored.


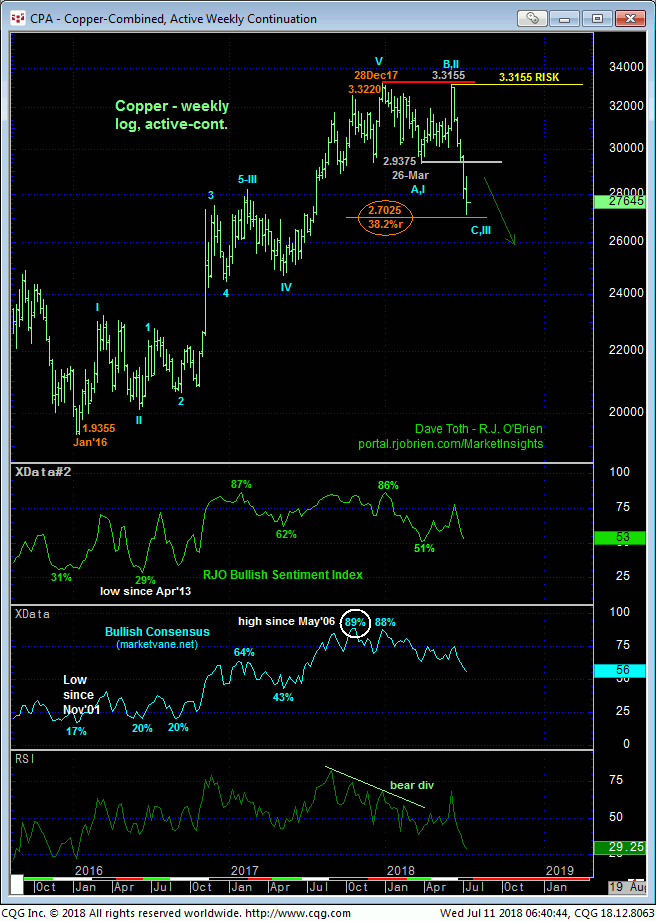
This tight but objective risk parameter at 2.8805 MAY come in handy given the market’s quick collapse to the (2.7025-area) 38.2% retracement of Jan’16 – Dec’17’s entire 1.9355 – 3.3220 bull run shown in the weekly log scale chart above. But while a confirmed bullish divergence in mo around this area might raise the odds that the bear might have ended or identified the lower boundary to a broader lateral range, there is no question that there could remain months or even quarters of a correction of a full 2-YEAR bull that has thus far only been corrected by six months of setback.
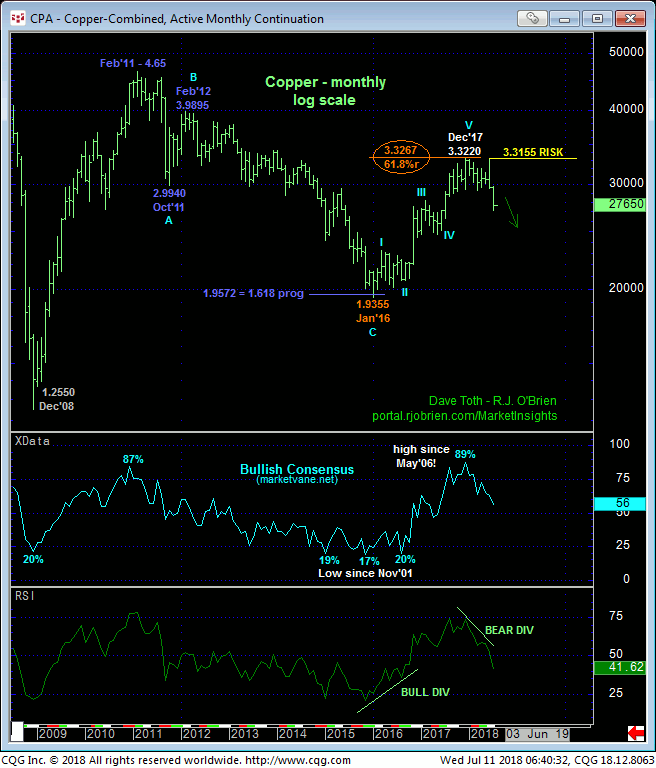
The Fibonacci fact that this year’s relapse stems from pretty much the exact (3.3267) 61.8% retrace of 2011-2016’s secular bear trend from 4.65 to 1.9355 on a monthly log basis below would seem to reinforce a major peak/correction/reversal count on this very long-term basis following a confirmed bearish divergence in MONTHLY momentum and a textbook 5-wave Elliott sequence up from Jan’16’s low as labeled below.
These issues considered, a bearish policy and exposure remain advised with a recovery above 2.8805 required to defer or threaten this call enough to warrant defensive measures commensurate with one’s personal risk profile. In lieu of such 2.8805+ strength further and possibly protracted losses straight away remain expected.


