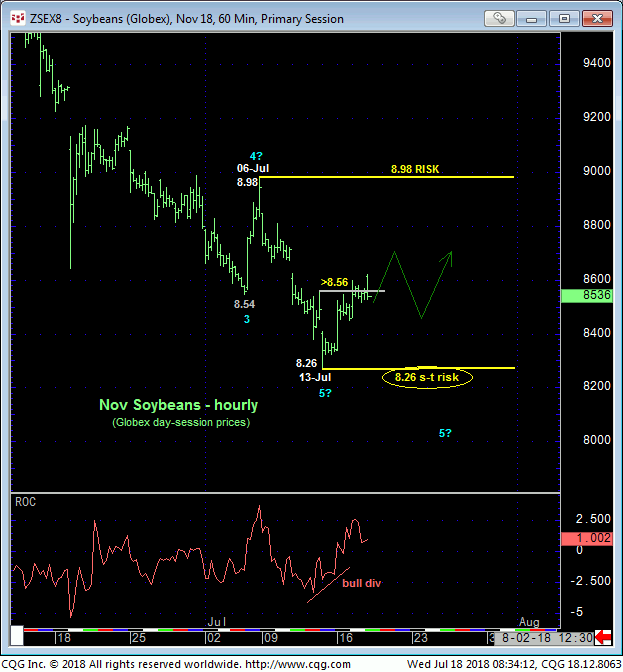
As always, we cannot conclude a larger-degree base/reversal count following proof of just short-term strength. And on the smallest of scales the market’s recovery above last Thur’s 8.56 minor corrective high confirms a bullish divergence in very short-term momentum as detailed in the hourly chart below. This admittedly short-term mo failure defines Friday the 13th’s 8.26 low as the end of the downtrend from 06-Jul’s 8.89 high, one of developing importance and a very short-term risk parameter from which shorter-term traders with tighter risk profiles can objectively base non-bearish decisions like short-covers and cautious bullish punts.

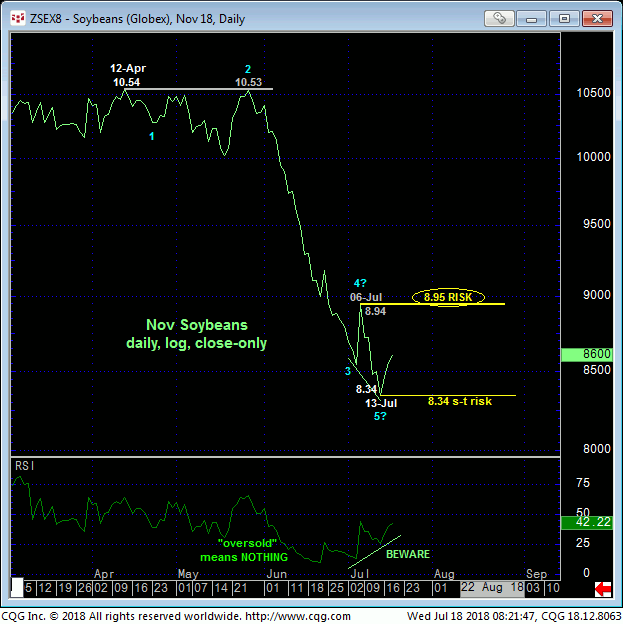
Commensurately larger-degree strength above 06-Jul’s 8.98 larger-degree corrective high and key longer-term risk parameter remains required to confirm a bullish divergence in momentum of a scale sufficient to break the major downtrend from, we believe, 12-Apr’s 10.54 high close shown in the daily log close-only chart below. Indeed, on this close-only basis below, the decline from that 12-Apr high is arguably a complete 5-wave Elliott sequence as labeled. However, proof of strength above 06-Jul’s 8.98 intra-day high and/or a close above that day’s 8.95 close is required to CONFIRM the divergence required to conclude a complete wave count and expose what would likely be shocking gains given the current fundamental climate. But ancillary evidence exists to beware of just such a larger-degree base/reversal-threat environment.

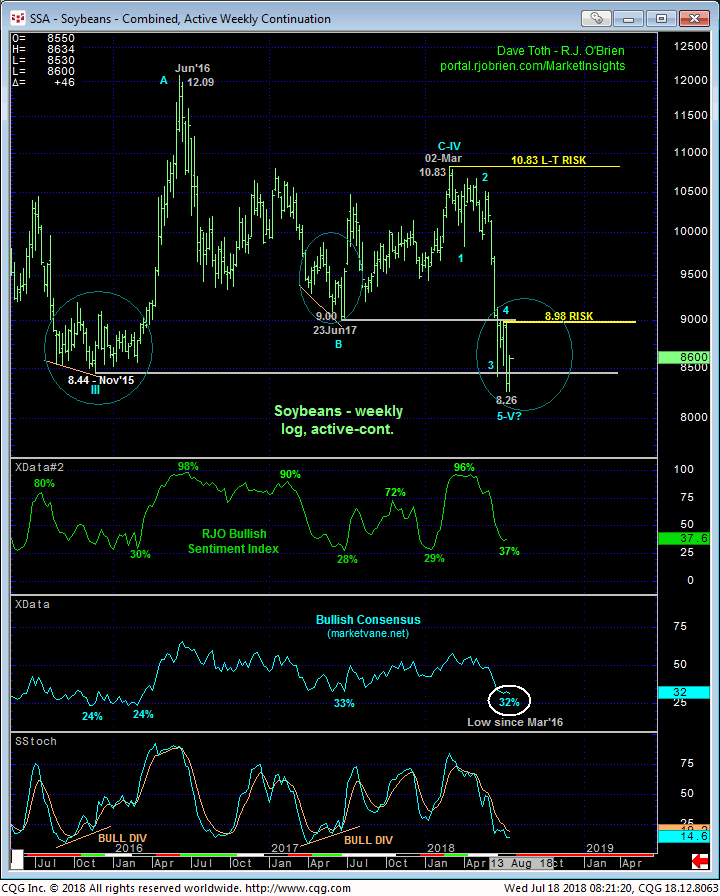
First, the weekly log active-continuation chart below shows the market’s flirtation with Nov’15’s obviously key 8.44 low and support. The market trickled through that key 8.44 level giving the bear every opportunity to perform. It’ll be very interesting to see, over the next few days to couple weeks, if the bear resumes below Friday the 13th’s 8.26 low and short-term risk parameter. If it doesn’t, and rather starts migrating towards 06-Jul’s key 8.98-area, then the contrary opinion fact that the huddled masses have flooded to the bear side may be an indication that this market has become vulnerable to higher prices as it was in Jan of this year, Jun’17 and Mar’16.

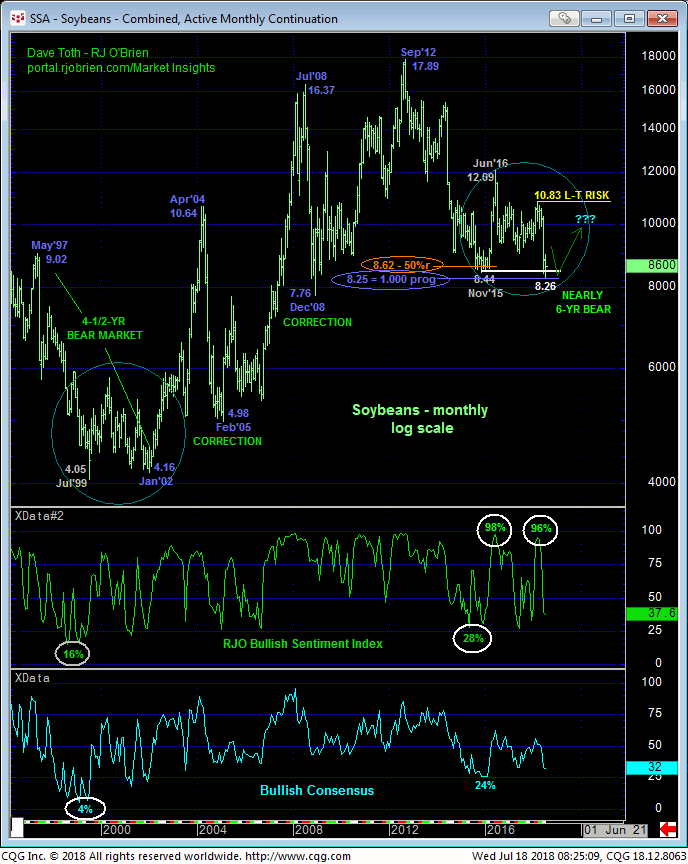
Additionally, with last week’s break to an 8.26 low, the secular bear market from Sep’12’s 17.89 all-time high has reached the exact length (i.e. 1.000 progression) of this market’s last secular bear market from May 1997’s 9.02 high to Jan’02’s 4.16 low shown in the monthly log scale chart below. This Fibonacci fact presents Friday the 13th’s 8.26 low as a “derived” level that we frown upon without an accompanying momentum failure of a scale sufficient to break the major downtrend. In this case and on an appropriate scale, that would mean a recovery above 8.98. Nonetheless, until the market breaks Friday the 13th’s 8.26 low required to nullify the short-term bullish divergence in mo and PROSPECT for a major base/reversal count, such a prospect is intact.
We have also pointed out over the past two years that ALL of the soybean market’s declines since that 1997 – 2002 bear have come within pennies of equaling (i.e. 1.000 progression) its length. COMBINED with the return to historically bearish sentiment and the market’s proximity to the (8.62) 50% retracement of the secular bull trend from Jan’02’s 4.16 low to 2012’s 17.89 high, traders are advised to approach this current condition with some “flexibility”, being open to the prospect that Friday the 13th’s 8.26 low could be the end of a nearly six year bear trend and start of a base/reversal environment that would ultimately be considered shocking.
A break below 8.26 negates any specific bullish count, reinstates the secular bear and exposes indeterminable and potentially significant losses thereafter. By the same token further strength above our key risk parameter at 8.98 will reinforce a base/reversal count that could be major in scope. Per such, longer-term players and producers remain advised to maintain a bearish/hedged position with strength above 8.98 required to threaten this call enough to warrant moving to a neutral position. Shorter-term traders with tighter risk profiles however are advised to move to a neutral/sideline policy at current 8.54 prices. We will be watchful for proof of labored, 3-wave corrective behavior on a retest of Friday the 13th’s 8.26 low that, if survived, could produce a very favorable risk/reward buying opportunity for those lucky enough to acknowledge the facts cited above and act on them.


