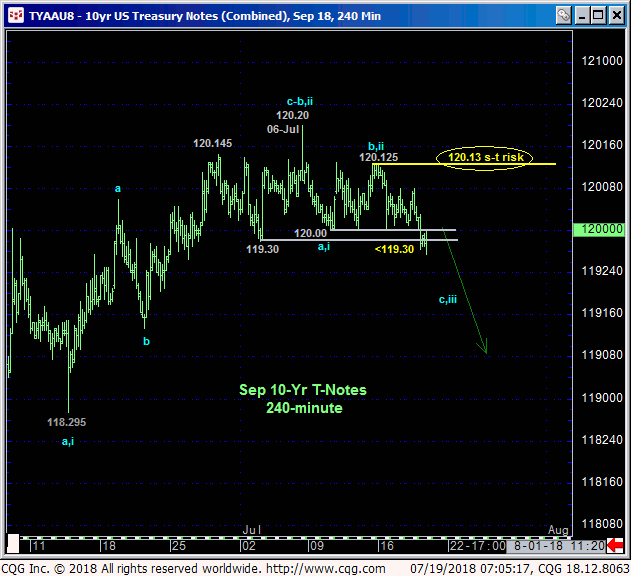
Overnight’s break below this month’s 120.00-to-119.30-area support confirms a bearish divergence in momentum that defines 06-Jul’s 120.20 high as the end of the rally from 13-Jun’s 118.295 low. By breaking 10-Jul’s 120.00 initial counter-trend low detailed in the 240-min chart below, the market has also identified 13-Jul’s 120.125 high as the latest smaller-degree corrective high that the market is now required to recoup to render the sell-off attempt from the 120.20 high a 3-wave and thus corrective affair consistent with a broader bullish count. In lieu of such 120.13+ strength further and possibly accelerated losses within the past six months’ range should not surprise. In this regard 120.13 is considered our new short-term risk parameter from which non-bullish decisions like long-covers and cautious bearish punts can now be objectively based and managed.


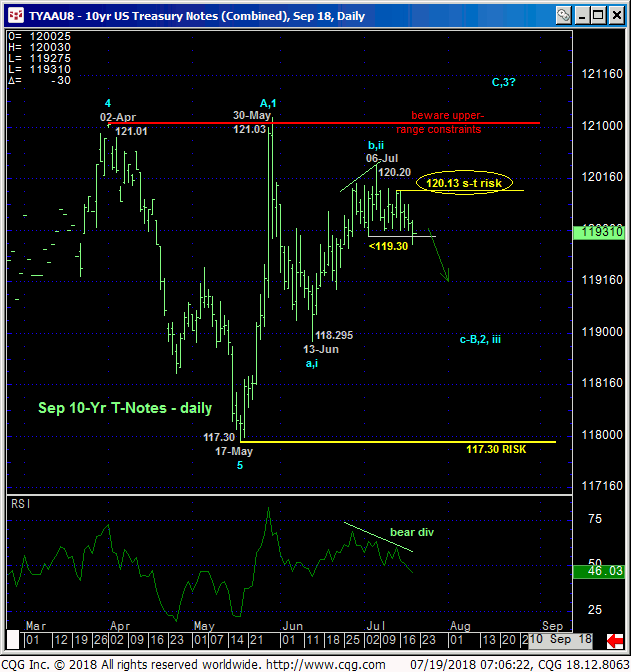
The daily chart above shows the bearish divergence in momentum that, in fact, breaks the uptrend from 13-Jun’s 118.295 low. But stemming from the extreme upper recesses of the past six months’ range, this indication of weakness could leave this market vulnerable to a relatively steep, if intra-range decline.
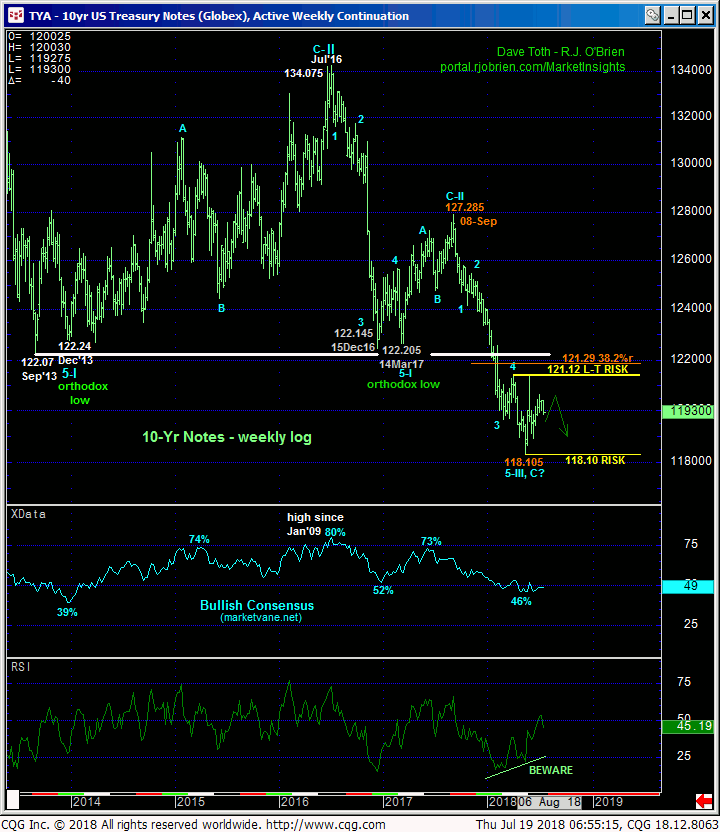
Traders are reminded that while the extent and impulsiveness of May’s rebound warns that mid-May’s low (117.30 basis the Sep contract and 118.105 on an active-continuation chart basis below) completed a major 5-wave Elliott sequence from last Sep’s 127.285 high and that these lows remain intact as key support conditions, the market has yet to provide any price action to threaten the secular bear market that we believe could span a generation. Against this very long-term backdrop, non-downtrending behavior like the past couple months is advised to first be approached as corrective selling opportunities.
Indeed, given the magnitude of the very long-term bear trend shown in the weekly chart below, any relapse stemming from today’s bearish divergence in daily mo may only be an intra-range relapse within a consolidation range between 118 and 121 that could span many months more or even the entire year. Ultimately, a sustained, impulsive spike above AT LEAST the 122-handle remains required to threaten this long-term bearish count.
These issues considered, traders are advised to move to a cautious bearish policy from 120.00 OB with a recovery above 120.13 required to negate this specific count and warrant its cover ahead of a then-probable resumption of at least the Jun-Jul rally and maybe a resumption of May’s rally to new highs above 121.03. In lieu of such 120.13+ strength we anticipate further and possibly accelerated losses to the 118-handle in the month ahead.


