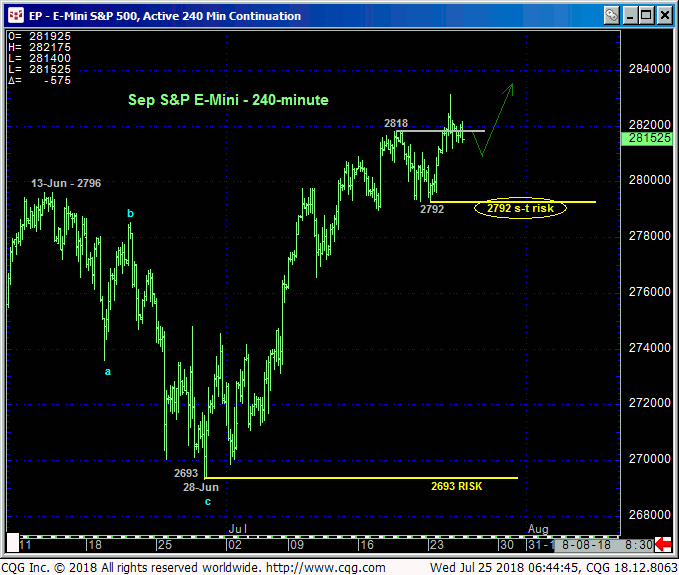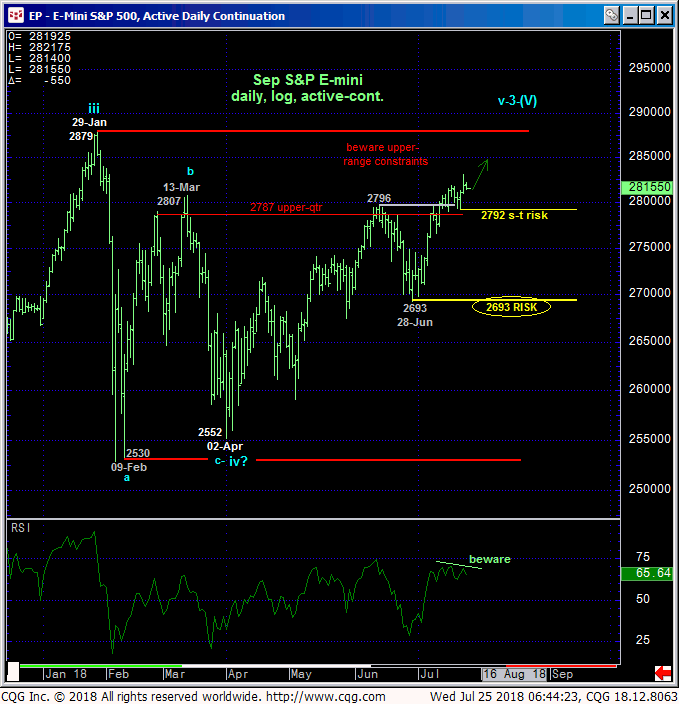
Yesterday’s continued rally above last week’s 2818 high leaves Mon’s 2792 low in its wake as the latest smaller-degree corrective low this market is now required to sustain gains above to maintain a more immediate bullish count. Its failure to do so will confirm a bearish divergence in short-term momentum that will break the uptrend from 28-Jun’s 2693 low and expose at least an interim correction of the past month’s portion of the broader bull. Per such we are defining 2792 as our new short-term risk parameter from which shorter-term traders with tighter risk profiles can objectively rebase and manage the risk of a still-advised bullish policy.


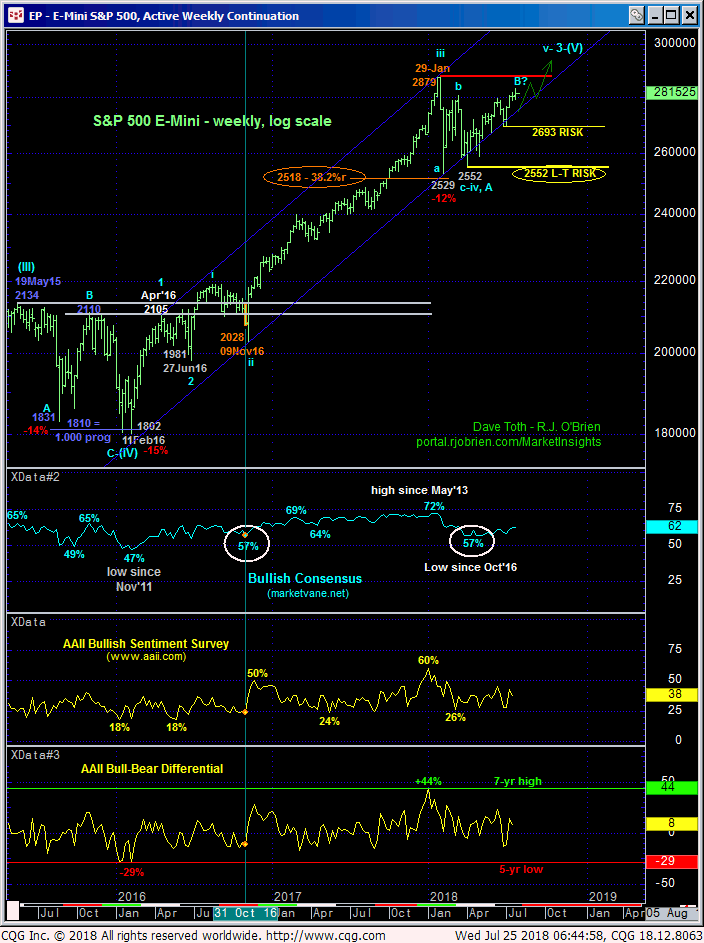
This tight but objective risk parameter may come in very handy given the market’s current position a the upper-quarter of this year’s entire 2879 – 2530-range. If there’s a time and place for this market to fail miserably and revert to a multi-quarter consolidation range, it is here and now. Until and unless such sub-2792 weakness is proven and, again, given this year’s mere lateral, consolidative chop consistent with the secular bull trend, there’s no way to know that the secular bull to levels potentially far above 29-Jan’s 2879 high hasn’t resumed and that such new all-time highs won’t lie directly ahead.
And even if the market fails below 2792, traders are reminded that this would be only a SHORT-TERM failure, allowing us to only conclude the end of the uptrend from 28-Jun’s 2693 next larger-degree corrective low and longer-term risk parameter. Indeed, to conclude a continuation of this year’s consolidation, the market would have to break 2693.
In sum, a bullish policy and exposure remain advised with a failure below 2792 required for shorter-term traders to step aside and perhaps for longer-term players to pare bullish exposure to more conservative levels, choosing to exchange whipsaw risk for larger nominal risk to 2693. In lieu of such weakness further and possibly accelerated gains remain expected, including a run at new all-time highs above 2879.


