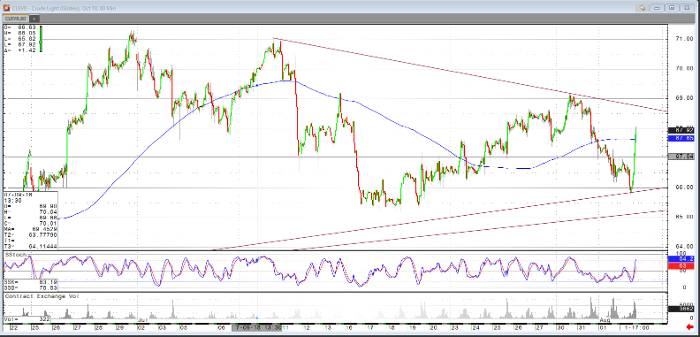
As of late Thursday morning, the October crude oil contract is trading near $67.75 per barrel, recovering today after being down most of the week. Today’s gains come after reports that Iran is preparing military drills near the strait of Hormuz following the sanctions on the country.
Yesterday, the market absorbed the weekly EIA report which yet again was in sharp contrast to the API the night prior, showing a build in crude oil inventories of 3.8 million barrels. There is also news of less compliance with production cuts and an even higher refining capacity rate of 96.1%.
From a technical standpoint, today’s strength follows a week of bearish trading and levels not visited in some time, as can be seen on the 60-minute chart below. Also visible are the narrowing range which could be representative of a potential breakout once the lower highs and higher lows are traded through. On a daily chart, should the market close at these levels, it would be a textbook outside day and a potentially bullish development. However, should today’s strength subside, and the week’s downtrend continue, the market could very possibly experience long liquidation given the heavy amount of long managed money as noted in RJO’s bullish sentiment index following Friday’s most recent Commitment of Traders report.
Crude Oil Oct ’18 60min Chart


