In the early morning trade, October gold is currently trading up for the day at $1218.0 and bouncing of a new fresh low possibly due to the slightly disappointing monthly non-farm payroll numbers this morning. October gold might even see more buyers at this level with the US dollar showing signs of weakness this morning. However, reports by The World Gold Council that second quarter global gold demand was weak adds even more fundamental pressure to the shiny one in the long term as it tries to find support above $1,200 an ounce. For gold bulls, I would continue to follow the September US dollar and if it falls and closes below $94, then it would become much safer to buy and hold onto gold.
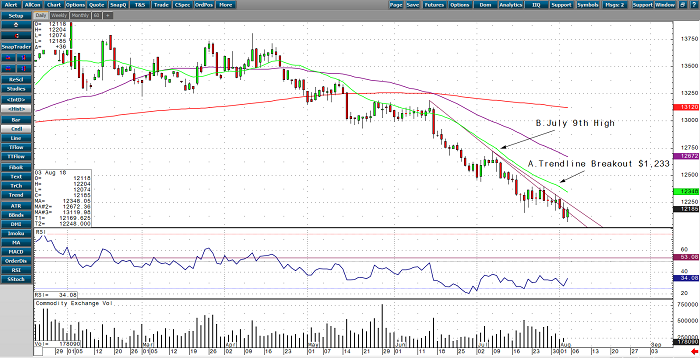
If we take a quick look at the October daily gold chart, you’ll clearly see the long-term downtrend in gold. If the market can break above this bearish trendline, which is highlighted below, then gold can catch some momentum buying up to the July 9 high of $1,272.3.
Gold Oct ’18 Daily Chart


