This week the EIA Petroleum Status Report showed a less than spectacular -1.4 million barrel draw, taking inventories to 407.4 million barrels (14.3% below their levels one year ago). Although this is a fundamentally bullish report, the market has responded by selling off, and likely due to lower than expected crude oil consumption. Surprisingly, US refineries were operating at 96.6% of their capacity, up .5% from last week and very near all-time highs for production. The increase in US refinery operations alongside a minimal draw on crude oil inventories seems to be sending mixed signals to the market, as crude oil prices have been generally lower since this report.
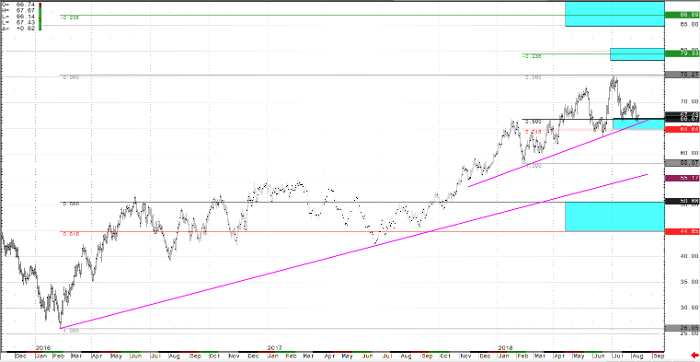
From a technical perspective, WTI crude oil futures have pulled back from the $75.00 technical price targets, and now find themselves entering a supportive inflection zone at $66.00. WTI crude prices found support into the $66.00 Fibonacci inflection zone, and while it remained above trend line support, had technical upside price projections into the $79.00 area. This scenario seems to be the path of least resistance, and the next logical progression of the trend was for a pullback to find the next supportive inflection zone (which has now occurred and proving to hold). While the market remains above $64.60 (61.8% Fibonacci technical ‘line in the sand’), this price level projects upside technical targets of $79.33 in the near-term. Below $64.60 at this time, would suggest a retest of last support at $55.00-50.00 inflection zones, and below those levels the continuation of the current multi-week and multi-month uptrend may come into questions.
In my opinion, the rally that has taken WTI crude prices above the $66.66 continuous contract highs (into the end of 2017 and start of 2018) is still a very important “break out higher” indicator for the market. Price action over the last several months has continued to hold the market above this key line in the sand and justifies keeping sights on higher prices in the near-term. The fight over trend seems to be all but won by the bulls, which has continued to take the market price higher since June of 2017. The recent pullback is currently testing supportive price levels that suggest bulls are still buying this market in pullbacks to continue trends higher. The trend is still up until it’s not, and I believe a break below the $64.60 price level would constitute a reversal at this time. Technical upside targets were hit, which has resulted in profit taking from the $75.00 to $76.00 inflection zone, and the market has simply pulled back into its next supportive price level, into $66.00. With WTI Crude prices above prior multi-year highs, the trend is up until it’s not (and I like to think, trend is my friend). When a market speaks, you must listen, and WTI crude may be telling us this is the beginning of a much larger trend being born.
Crude Oil Daily Chart


