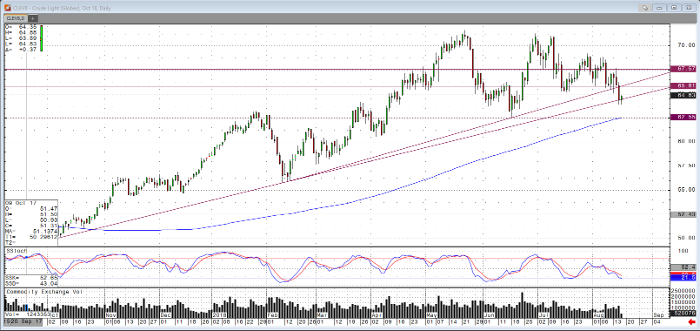
As of Thursday morning, the October crude oil contract was trading near the $64.50 price level following Thursday’s EIA report which featured a build in inventories of 6.9 million barrels. This report coupled with an increasingly stronger dollar and diminishing supply and demand prospects amid increasing geopolitical risks has lead the contract to a bearish posture.
Of course, this is visible in the daily chart below as the market has made lower highs for the last month and a half and has also traded to at the lowest levels in that timeframe in the past 48 hours. Should the bear trend continue, it will be interesting to see if the $62.50- 63.60 level which coincides with the 200-day moving average and the June 18 low.
Eyeing whether the trendline support pictured below holds may provide guidance in addition to monitoring other factors such as:
– Currencies, especially dollar index strength as well as Lira contagion
– Geopolitical risk amid United States/Turkey, United States/China, Turkey/EU, and GBP/Eu
– An extremely high refinery capacity rate of 98.1%
To discuss this market in greater detail and put together a trading plan customized to your account, please contact me at your convenience.
Crude Oil Oct ’18 Daily Chart


