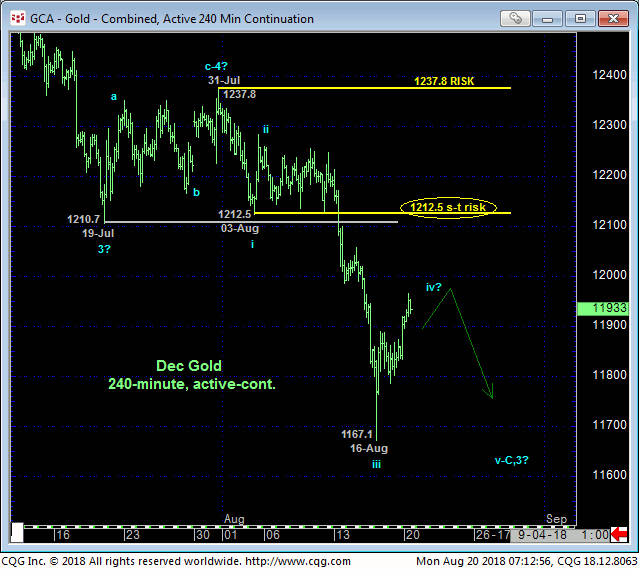
Against the backdrop of this year’s broader slide we’ll discuss in more detail below, the past couple days’ rebound is advised to first be approached as a corrective hiccup ahead of resumed losses. Former 12010-to-1212-area support is considered new near-term resistance with strength above 03-Aug’s 1212.5 (suspected minor 1st-Wave) low minimally required to jeopardize the impulsive integrity of a more immediate bearish count and provide the first indication of a base/reversal threat that could be major in scope. Per such this 1212.5 levels is considered our new short-term risk parameter from which shorter-term traders with tighter risk profiles are advised to rebase and manage the risk of a still-advised bearish count.


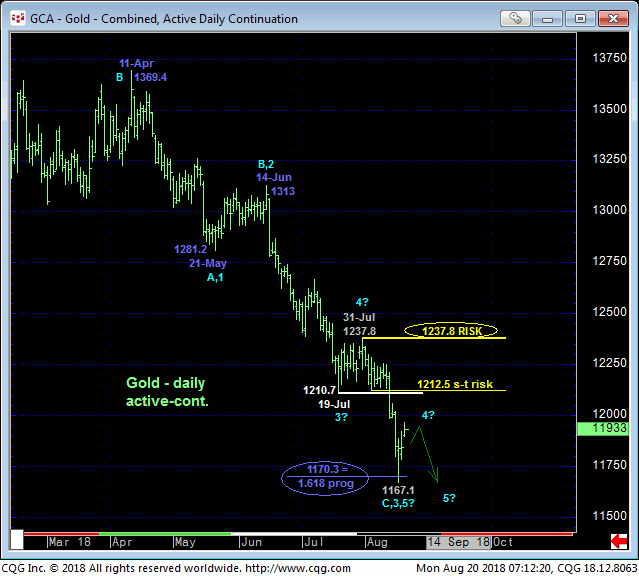
Looking at the daily chart above, there’s no way to tell if last week’s 1167.1 low completed a 3-wave or 5-wave decline from 11-Apr’s 1369.4 high. Commensurately larger-degree strength above 31-Jul’s 1237.8 larger-degree corrective high and our key risk parameter remains required to, in fact, break the major downtrend and expose a base/reversal environment that we believe could be major in scope. This base/reversal-threat environment is predicated on:
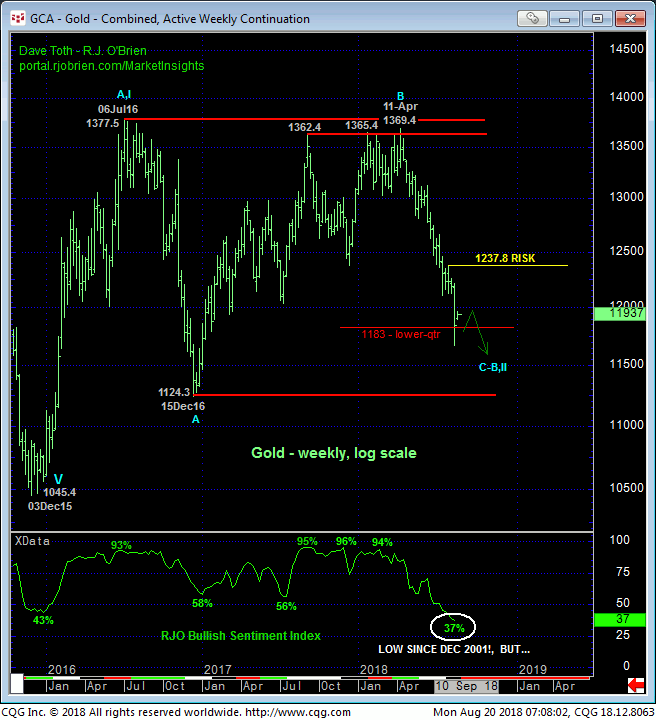
- the market’s return to the lower-quarter of 2-1/2-year range shown in the weekly log chart below amidst
- historically bearish levels in our RJO BSI not seen since 2001!
Additionally, we find it interesting that 16-Aug’s 1167.1 low is only three bucks away from the (1170.3) 1.618 progression of Apr-May’s 1369.4 – 1281.2 initial decline from 14-Jun’s 1313 corrective high.
In sum, it’s not hard to find reason to be very watchful for a base/reversal environment that could be very opportunistic from a longer-term perspective. However, strength above at least 1212.5 and preferably 1237.8 is required to threaten and mitigate the bear and warrant a shift from the bear side to a new bullish policy. In lieu of such strength the past few days’ bounce is advised to first be approached as a corrective hiccup ahead of at least one more round of new lows below 1167.1.


