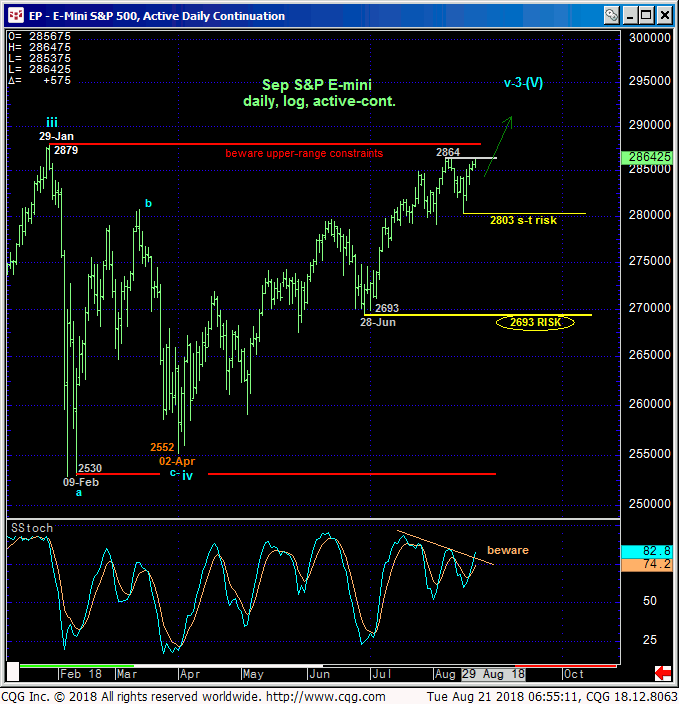
Overnight’s break above 07-Aug’s 2864 high reaffirms the 4-1/2-month uptrend and leaves 15-Aug’s 2803 low in its wake as the latest smaller-degree corrective low this market is now minimally required to fail below to even defer, let alone threaten the bull. Per such 2803 is considered our new short-term risk parameter from which a still-advised bullish policy and exposure can be objectively rebased and managed by shorter-term traders wit tighter risk profiles.
The daily log chart below also shows only 29Jan18’s 2879 high standing between spot and another round of all-time highs for the secular bull market. What’s interesting (and opportunistic) here is that the past four months’ rally has been one of the most doubted and arguably challenging in recent memory because of its 2-steps-up-1-step-back-down demeanor. But it’s been our observation over decades that such “rising-wedge-type” behavior usually means one of two things: waning upside momentum ahead of a reversal lower OR a sort of “coiling-up” before the trend goes ballistic.
Such trepidation is not too unusual up against the upper-quarter of a long-established range. But a range is only a range until the trend blows one boundary or the other out. And currently, only a glance at the daily chart below is needed to see that odds favor a bullish bust-out.

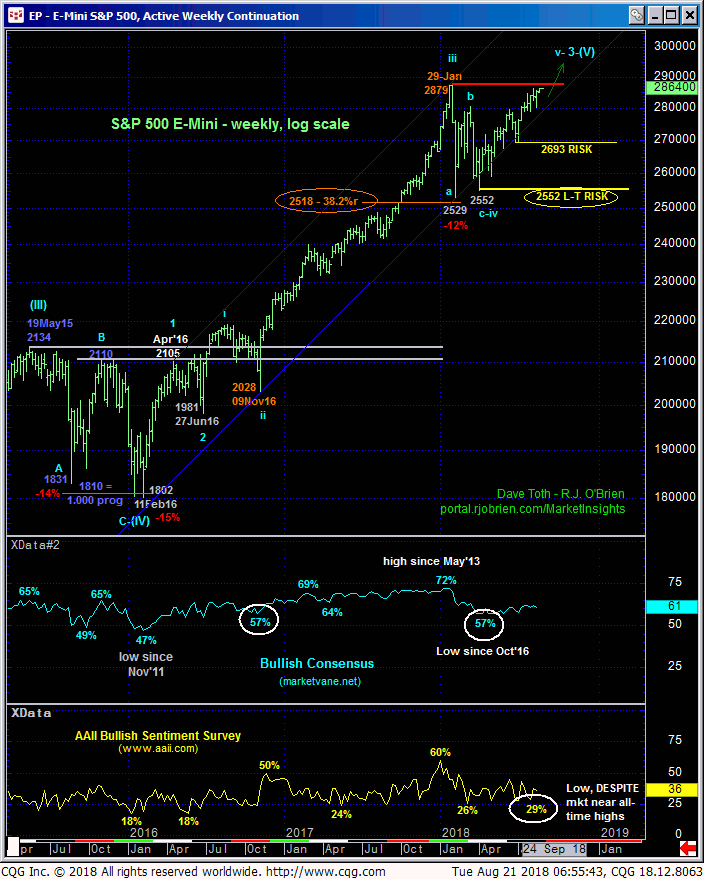
Indeed, it was only a couple weeks ago when the American Association of Individual Investors sentiment survey (shown in the yellow in the weekly log chart below) was flirting with historic LOWS DESPITE the market flirting with all-time highs. Against the backdrop of the secular bull trend so clear in the chart below, we believe this combination warns of a potentially explosive resumption of the trend straight away.
In sum, a full and aggressive bullish policy and exposure remain advised with a failure below 2803 minimally required for shorter-term traders to move to the sidelines and perhaps for even longer-term players to pare bullish exposure to more conservative levels. In lieu of such sub-2803 weakness further and possibly accelerated gains are anticipated straight away.


