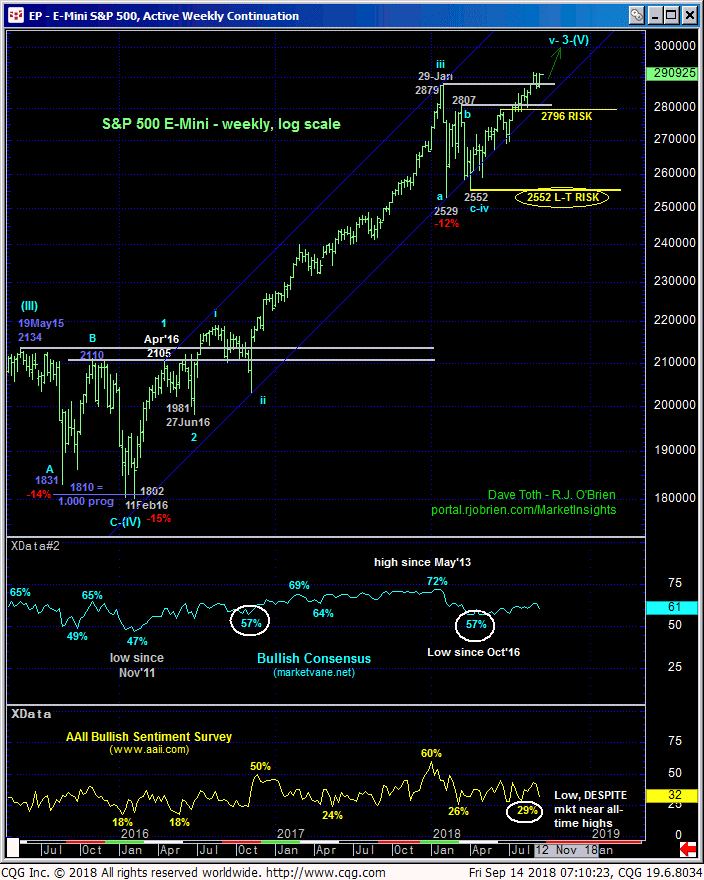
Despite the fact that the trend in S&Ps is up on all but the most microscopic of scales and is once again just spittin’ distance from 29-Aug’s 2918 all-time high, the American Association of Individual Investors (AAII) bullish sentiment survey actually FELL 10 points this week to 32%. Along with only a luke warm reading of 61% in the Bullish Consensus (marketvane.net), again, DESPITE the fact that this super bull has shown virtually no signs of technical weakness, we believe the trend is not only poised to continue to further all-time highs, but to ACCELERATE higher.

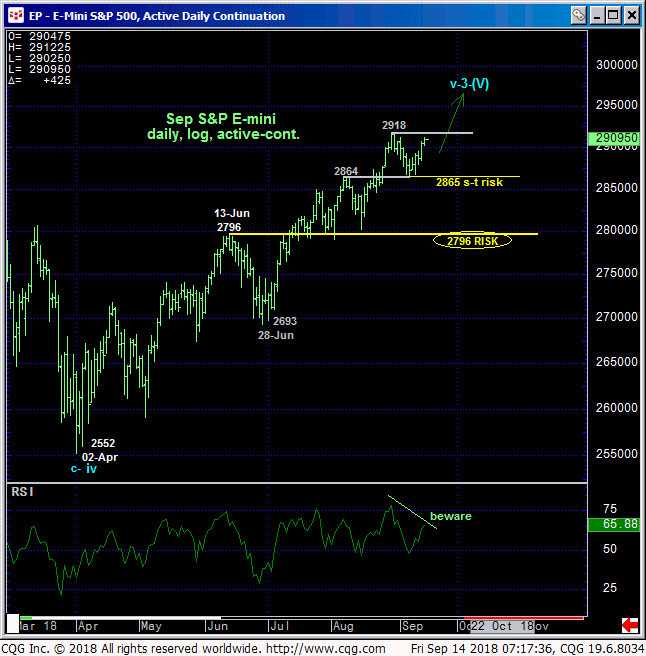
From a longer-term risk perspective, we advise longer-term players to trail protective sell-stops to levels just below 13-Jun’s 2796 high and new long-term risk parameter. In both the daily log chart below and weekly log chart above, this level lies below a ton of now-former and key resistance between 2879 and 2807, an area this market should not even come close to per any broader and more immediate bullish count. Indeed, this super bull has thus far been very ORDERLY in its ascent. So orderly or even BORING that it has incited anything less than all-out euphoria that we believe warns of UPSIDE VULNERABILITY that the huddled mass doubters will be forced to CHASE at much higher levels.

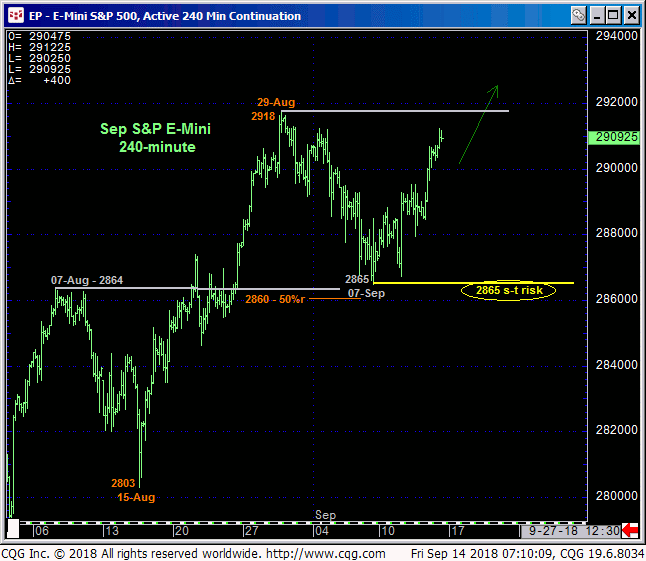
From a short-term perspective detailed in the 240-min chart below, and while the market hasn’t confirmed it yet with a 2918+ continuation of the bull, we believe 07-Sep’s 2865 low completed or defined the lower boundary to the latest bull market correction. Per such, shorter-term traders with tighter risk profiles are advised to consider 2865 as our new short-term risk parameter to a still-advised bullish policy and exposure.
In sum, a full and aggressive bullish policy and exposure remain advised with a failure below 2865 required for shorter-term traders to move to the sidelines and perhaps for longer-term players to pare bullish exposure to more conservative levels. In lieu of at least such sub-2865 weakness, we anticipate further and possibly accelerated gains straight away.


