NOV SOYBEANS
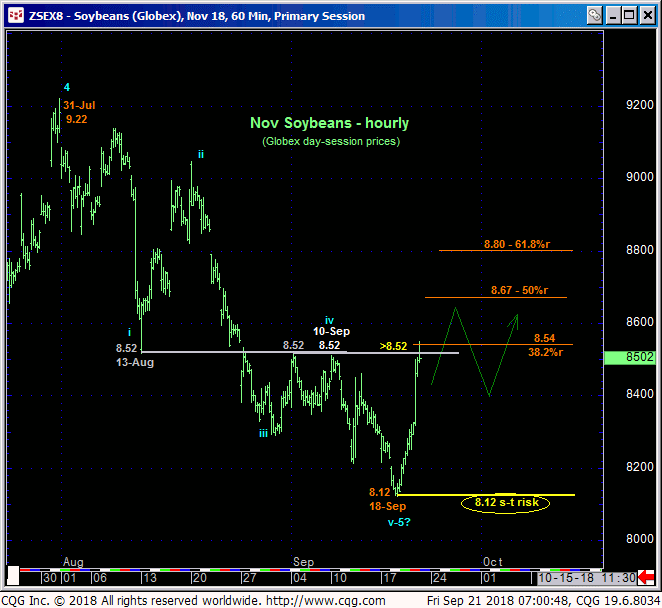
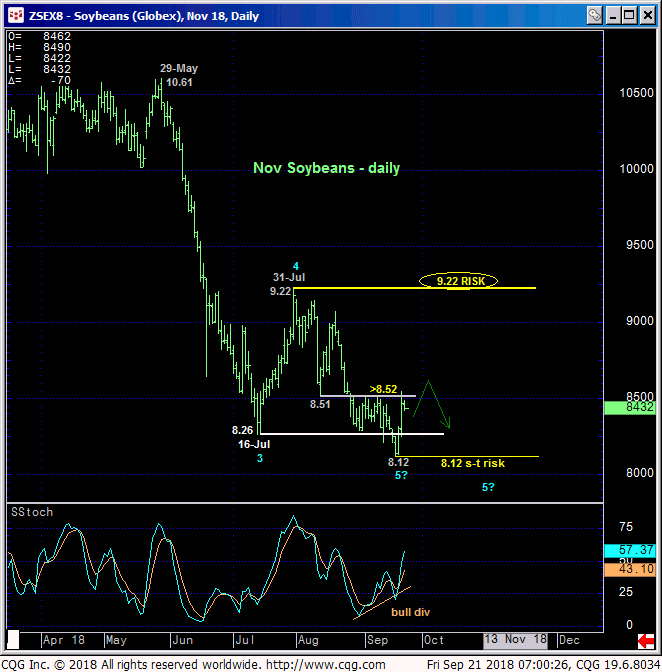
Forever and always, you cannot conclude a larger-degree base/reversal following proof of just smaller-degree strength. The philosophical counter to this is that a journey of 10,000 ticks starts with a single bullish divergence step. It’s grossly premature to conclude such a broader base/reversal count in beans following yesterday’s bullish divergence in momentum above 10-Sep’s 8.52 minor corrective high and short-term risk parameter discussed in Tue’s Technical Blog, but one thing we know for sure is that the market has rejected/identified Tue’s 8.12 low as one of developing importance and THE specific and objective and new short-term risk parameter this market is now required to relapse below to squelch any base/reversal gibberish and re-expose the secular bear trend per the obviously and grossly bearish fundamental picture. Until and unless the market relapse below 8.12 and for reasons we’ll detail below, traders are advised to be aware of the prospect that Tue’s 8.12 low may have completed this year’s 6-month downtrend from 02-Mar’s 10.83 high.


Indeed and against the backdrop of not only the past month-and-a-half’s downtrend from 31-Jul’s 9.22 high but also the secular bear trend from 2012’s 17.89 all-time high, the past couple days’ burp falls well within the bounds of a mere correction ahead of an eventual resumption of the bear to new lows below 8.12. Despite the poke above 10-Sep’s 8.52 corrective high that, in fact, breaks Aug-Sep’s downtrend from 9.22 to 8.12, former 8.52-area support remains generally intact as new resistance. Plus, this rebound has thus far only retraced a Fibonacci minimum 38.2% of this latest portion of the long-term bear. Long-term players with commensurately larger-degree risk assumption to 31-Jul’s 9.22 larger-degree corrective high and long-term risk parameter should welcome this pop as another corrective selling opportunity.
HOWEVER, the following facts and observations should likewise be considered with respect to a base/reversal prospect that, if correct, presents an extraordinary risk/reward buying opportunity:
- the confirmed bullish divergence in daily momentum breaks the downtrend from 31-Jul’s 9.22 high and identifies 18-Sep’s 8.12 low as THE short-term risk parameter the market is required to break to negate a base/reversal count
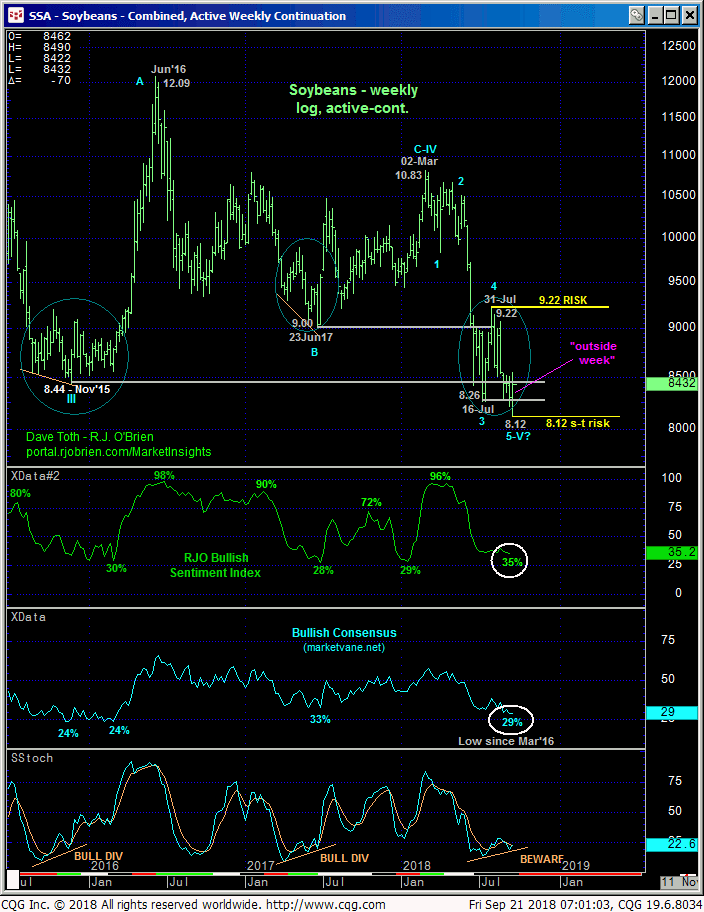
- this latest portion of the bear from 31-Jul’s 9.22 high arguably completes a textbook 5-wave Elliott sequence from Mar’s 10.83 high as labeled in the weekly log chart below
- unless the market closes below last Fri’s 8.12 close, this week’s recovery will result in an “outside week” (lower low, higher high and higher close than last week’s range and close)
- historically bearish market sentiment that has warned of and accompanied virtually every major base/reversal environment and
- the market’s general position around Nov’15’s historic 8.44 low, the failure to sustain losses below would also contribute to a major base/reversal count.
IF this week’s rebound is the start of a more protracted correction and reversal higher, then the next evidence of such would be expected to show up in labored, corrective, 3-wave relapse attempts (the third of our three reversal requirements following 1) a bullish divergence in mo and 2) trendy, impulsive behavior up). In the week or two ahead we will expect a rebuttal to this week’s rebound and be watchful such proof of labored, corrective behavior that, if provided and stemmed with another bullish divergence in short-term mo, will expose an acute risk/reward buying opportunity.
These issues considered, shorter-term traders have been advised to neutralize bearish exposure and keep powder dry in a neutral/sideline position for the time being. Long-term players may want to pare bearish exposure to more conservative levels, but commensurately larger-degree strength above 9.22 remains required to break the major downtrend and expose a base/reversal count that we’d believe at that point to be major in scale. Needless to say a relapse below 8.12 negates any base/reversal count, reinstates the bear and exposes potentially extensive losses thereafter.

DEC CORN
For all intents and purposes the technical construct of the corn market is virtually identical to that detailed above in beans following Dec corn’s bullish divergence in short-term mo above our short-term risk parameter defined by 14-Sep’s 3.52 corrective high detailed in the hourly chart below. This short-term mo failure defines Tue’s 3.42 low as one of developing importance and our new short-term risk parameter from which non-bearish decisions like short-covers and cautious bullish punts can be objectively based and managed by shorter-term traders with tighter risk profiles.


From a longer-term perspective however this week’s pop falls well within the bounds of a mere bear market correction and selling opportunity for longer-term players. Commensurately larger-degree proof of strength above 05-Sep’s 3.69 larger-degree corrective high and key risk parameter remains required to not only break the downtrend from 31-Jul’s 3.89 high, but arguably complete another correction in a loooooong series of intra-four-year-range relapse attempts rejected by the (3.42-to-3.15) lower-quarter of this range.
At 33%, the Bullish Consensus (marketvane.net) has returned to a historically low level that has warned of and accompanied EVERY major base/reversal environment within this incessant 4-year range. Currently and as expressed above, this week’s bullish divergence in short-term mo is of an insufficient scale to break even the past month-and-a-half’s downtrend and CONCLUDE a major reversal, so we’re not taking any liberty currently with this contrary opinion tool being applicable to a broader base/reversal count. But nonetheless this historically bearish sentiment indicator must be considered a threat, lying in the proverbial weeds like a Minnesota pike.
As we’ve discussed many times over the past four years and while acknowledging a still-arguable longer-term downtrend, “down here” around the lower-quarter of this massive 3.15-to-4.54-range longer-term traders should be going out of their way to find reasons to BUY, not sell. Only a glance at the weekly chart below is needed to see that a bearish policy “down here” has born little fruit. Per such and, again, while acknowledging the prospect that the longer-term, if intra-range trend remains arguably down, even smaller-degree bullish divergences in momentum should not be ignored as contributions to a broader base/reversal process. This underscores the importance of technical and trading SCALE and adherence to personal risk profile.
In sum, shorter-term traders have been advised to move to a neutral/sideline position as a result of yesterday’s bullish divergence in short-term mo above 3.52. A relapse below 3.42 is now required to negate this call, reinstate the bear and expose potentially steep losses. Longer-term players are OK to pare bearish exposure to more conservative levels with commensurately larger-degree proof of strength above 3.69 required to warrant an immediate cover of remaining exposure and move to a new bullish policy. We will be watchful in the days ahead for proof of labored, corrective, 3-wave behavior on a relapse attempt that will help us with the next phase of this transition from a broader bearish policy to a new bullish one.
Strap in. We believe the next few weeks to a couple months could provide extraordinary and acute risk/reward trading and hedging opportunities.


