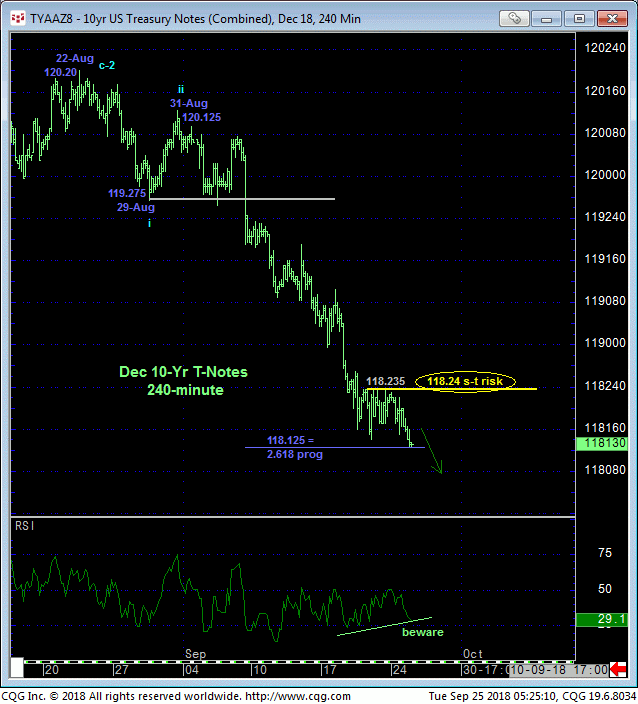
Overnight’s break to new lows below Thur’s 118.14 low reaffirms the developing downtrend and leaves Fri’s 118.235 high its wake as the latest smaller-degree corrective high this market is now minimally required to recoup to confirm a bullish divergence in short-term momentum, stem the slide and expose at least an interim corrective rebound. Per such we are identifying 118.24 as our new short-term risk parameter from which our bearish policy and shorts from 120.175 recommended in 27-Aug’s Trading Strategies Blog can be objectively rebased and managed by shorter-term traders with tighter risk profile.
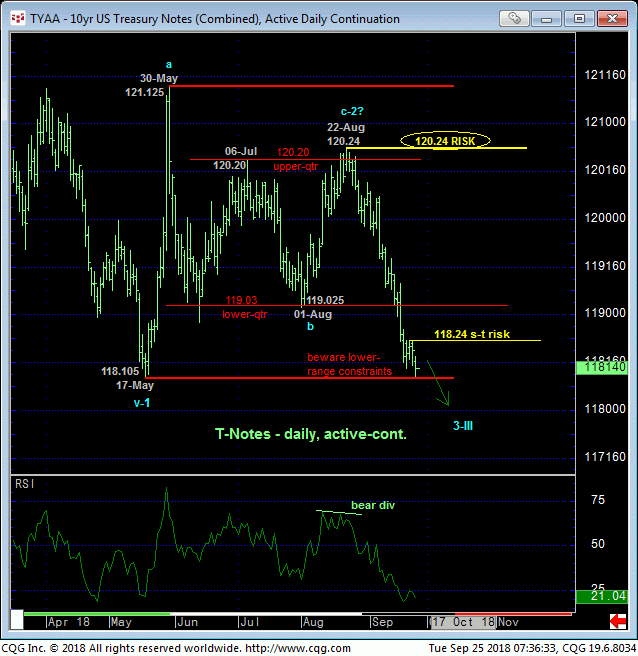
This tight but objective risk parameter may come in handy given the market’s engagement of 17-May’s key 118.105 low, the lower boundary to the past 4-1/2-months’ range and the only remaining support separating the market from resuming a secular bear trend. On a commensurately larger-degree basis 22-Aug’s 120.24 remains as our key long-term risk parameter the market is required to recoup to even defer, let alone threaten what we believe is a secular bear market that could span a generation.
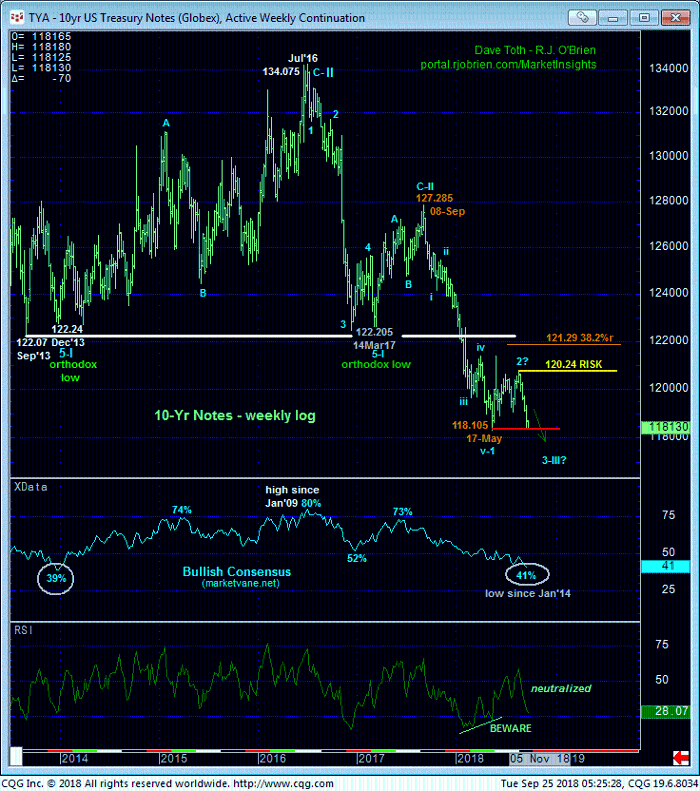
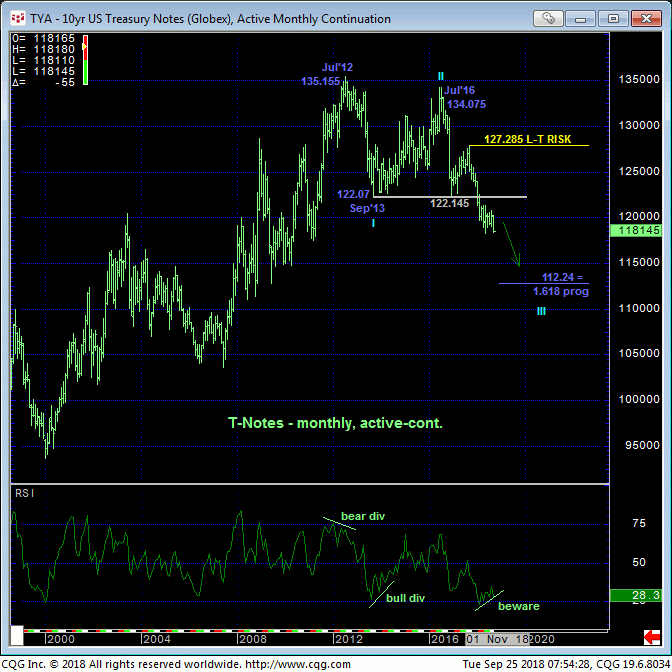
Indeed, only a glance at the monthly chart below is needed to see the gravity of a MULTI-YEAR PEAK/REVERSAL PROCESS that dates from Jul’12’s 135.155 all-time high. Following 2012-13’s momentum failure that broke the uptrend from at least Mar’11’s 117.18 low, Jan’18’s relapse below the pivotal 122-handle, in fact, established the new secular trend as down. And as we’ll show below, this downtrend is arguably reversing a 35-YEAR bull market in U.S. Treasuries.
Given the massive scale of this reversal and its even more massive multi-year or even multi-decade ramifications lower, a recovery above at least former 122-handle-area support-turned-resistance and preferably Sep’17’s 127.285 high is required to threaten or negate this long-term very bearish call.
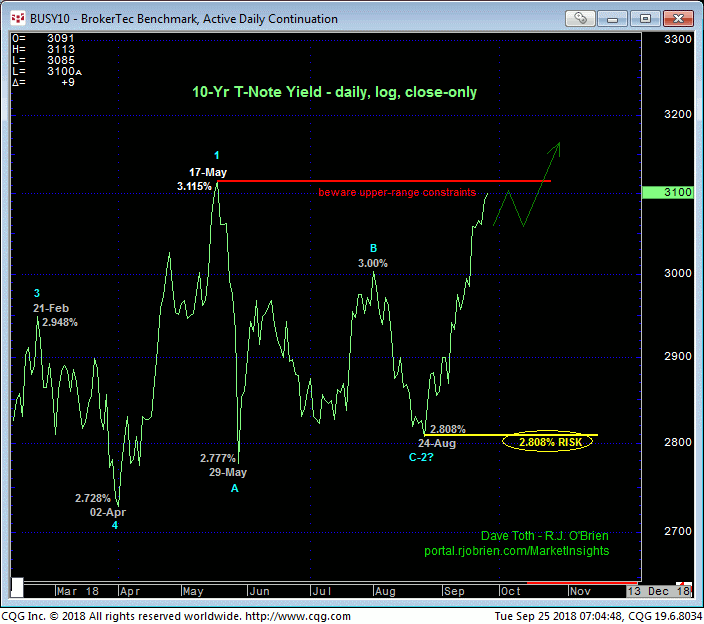
On a yield basis, the daily log close-only chart shows the market still capped by 17-May’s 3.115% high. “Up here” a tighter but objective risk parameter like that 118.24 level cited at the start of this analysis can play an important role.
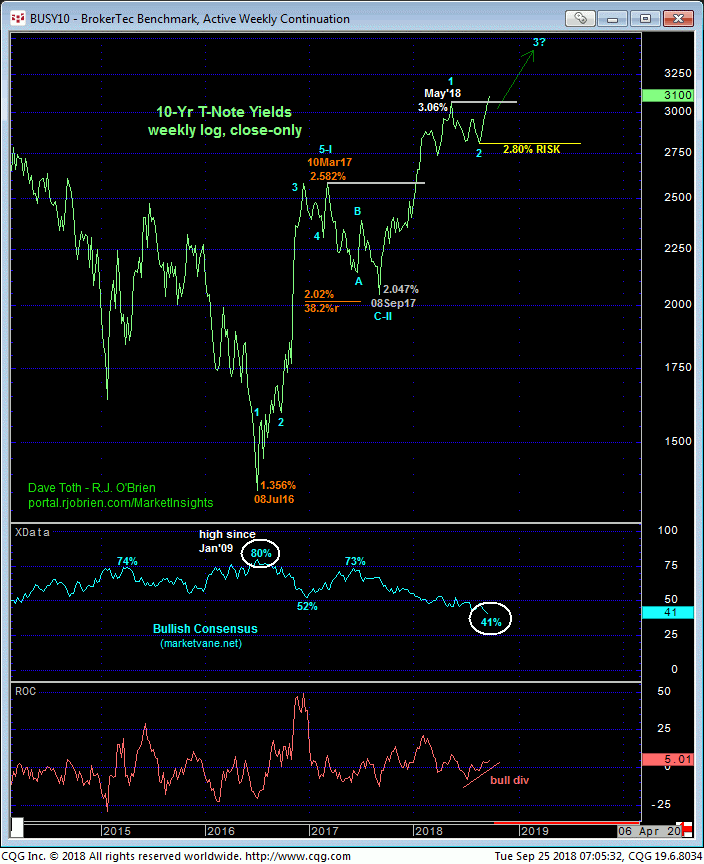
A break above that 3.115% level however will reinstate and reaffirm the secular uptrend from 08Jul16’s 1.356% low weekly close shown in the weekly log close-only chart below. A point to be gleaned from this weekly perspective are the relatively minor setbacks within this major rate rise the market has only been able to achieve. Mar-Sep’17’s relapse attempt came within a skosh of a Fibonacci minimum 38.2% retrace of Jul’16 – Mar’17’s 1.356% – 2.582% move. The recent May – Aug relapse attempt is an even smaller retrace of Sep’17 – May’18’s 2.047% – 3.06% rate rise. To us this means paltry bullish moves (in the contract) and domination by the bear.
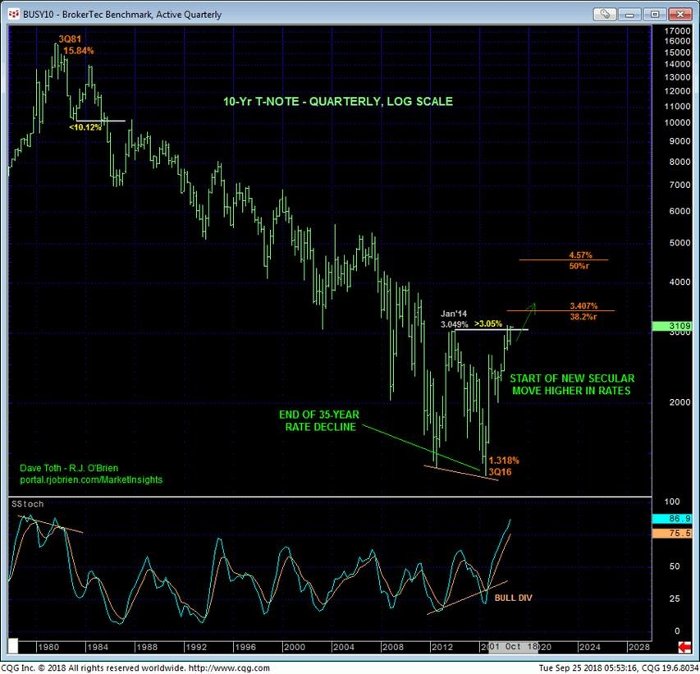
Lastly, the historical quarterly log scale chart below puts the past couple years’ rate action in perspective. This year’s earlier (Apr/May) recovery above Jan 2014’s 3.049% high confirms a bullish divergence in momentum that defines 3Q16’s 1.318% low as the END of a 35-YEAR downtrend in rates. How long will a correction or reversal last? Of course, there’s no way to know. But to suggest that the recovery won’t or can’t be a 5- or 10- or 15- or even 20-year affair would be baseless.
The past 15 years of the secular downtrend in rates has been particularly volatile, and there’s no way to know that the early stages of a massive rebuttal won;t be equally volatile and include potentially extensive relapses. Herein lies the importance of well-defined and objective risk parameters in the contract like 120.24 and perhaps even 118.24. But for market participants who might not have even been born when Volcker and the bond vigilantes were making headlines that accompanied the start of a 35-year rate decline, such rate relapses and contract rebounds, even extensive ones, would arguably remain within the context of a new secular trend higher in rates that could span years or even decades.
These issues considered, a bearish policy and exposure remain advised with a recovery above 118.24 required for shorter-term traders to take profits on shorts and step aside to circumvent the heights unknown of what would be a suspected corrective hiccup. Long-term players would be OK to pare some bearish exposure on 118.24+ strength, but commensurately larger-degree strength above 120.24 remains required to negate our long-term bearish count and warrant its cover. In lieu of strength above at least 118.24, further and possibly accelerated losses remain expected.
