In the early morning trade, December gold is slightly in the green and trading at $1,199.0 an ounce. After gold’s technical breach and sell-off yesterday, it is not really showing any kind of weakness or follow through so far this morning. Furthermore, some might see this as a positive for gold because the U.S. dollar has been on an absolute tear to the upside over the last two trading sessions. However, after December gold’s failure to hold the $1,200 an ounce handle, the shiny one is now open to retesting the August low of $1,167.1. Why did it fail to hold the $1,200 an ounce handle? I believe is because of the Feds action on Wednesday which caused the dollar to shoot up and metal across the board to come down.
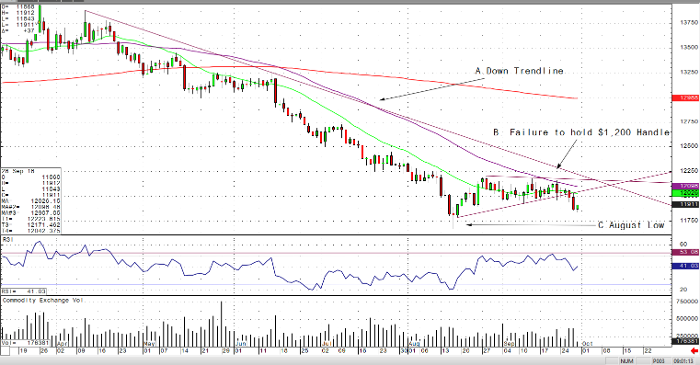
In the short-term, gold’s next move might be based on the technicals, so let’s take a quick look at a December gold daily chart. You’ll clearly see that gold is in a long-term downtrend and this week it failed to hold onto and break above the $1,200 handle. Now, the shiny one is trading at its lowest level in 3 weeks and is prone to retest the August low of $1,167.1. If you’re just looking at the daily gold chart, you’ll clearly see the bearish downtrend and bearish chart patterns which I highlighted below.
Gold Dec ’18 Daily Chart


