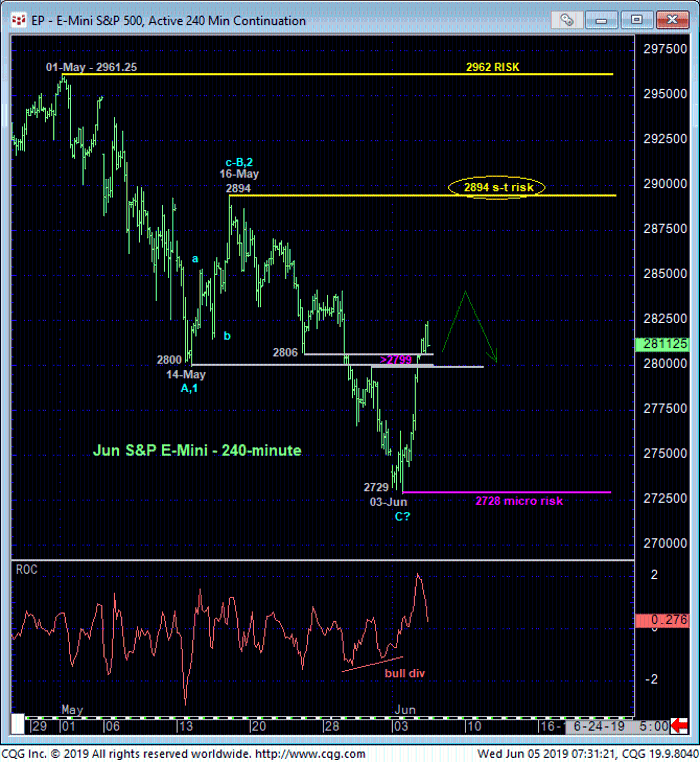
The market’s smart recovery yesterday above our micro risk parameter defined by 30-May’s 2799 minor corrective high and area of former support-turned-resistance is not unimpressive and certainly defines Mon’s 2728.75 low as one of developing importance. But relative to May’s broader setback this recovery is thus far insufficient to conclude anything more than an interim corrective hiccup ahead of a resumption of the broader slide. In this regard traders can use 2728 as an objective micro risk parameter from which to base non-bearish decisions like short-covers and cautious bullish punts. But to conclude that 2728.75 low as the end of a 3-waver and thus corrective affair from 01-May’s 2961 all-time high, the market is still required to recover above 16-May’s 28.94 corrective high and short-term risk parameter. And even then, the market would still have that 01-May high and resistance at 2961.25 to deal with.
IF the past couple days’ rebound is the start of something bigger to the bull side, it should follow up this rally with proof of labored, corrective, 3-wave behavior on subsequent relapse attempts. If, conversely, this pop is another bear market correction, then the market would be expected to exhibit trendy, impulsive behavior as it trades lower.


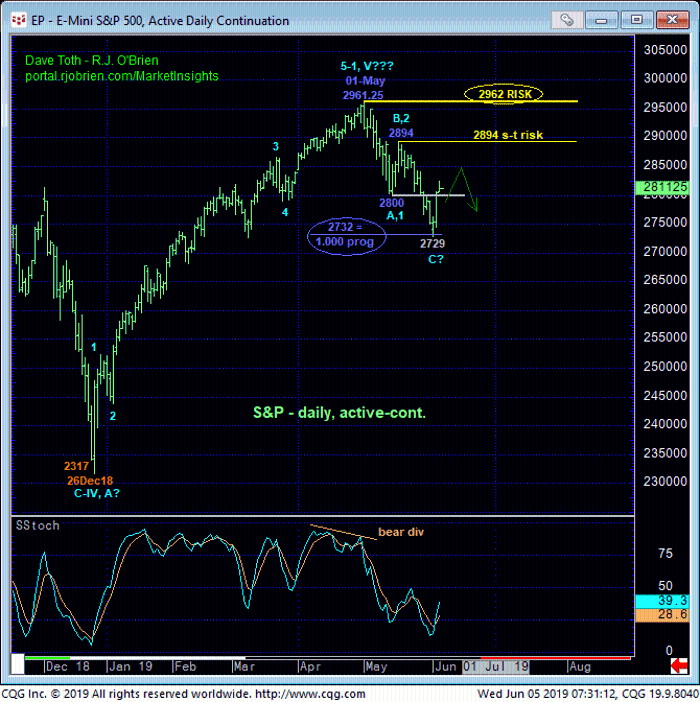
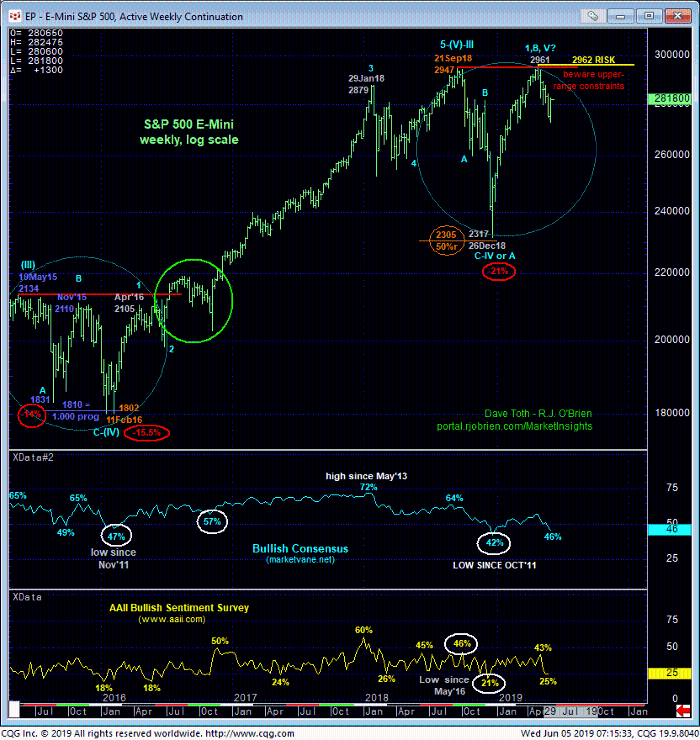
Per an alternate bullish count, it is interesting to point out that the (prospective C-Wave) decline from 16-May’s 2894 high came within a mere three points of equaling (i.e. 1.000 progression) 01-to-14-May’s initial (prospective A-Wave) decline in length. And as discussed in 29-May’s Technical Blog, the fact that the sentiment/contrary opinion indicators are already at historically bearish levels would seem to reinforce a broader bullish count. So the market’s not totally devoid of bullish technical factors that result in a resumption of the secular advance. The missing link at this point however remains proof of strength above at least 16-May’s 2894 corrective high needed to, in fact, break the downtrend from 01-May’s 2961.25 high. Until and unless such 2894+ strength is shown, it would be premature to conclude that this week’s rebound is anything more constructive than another corrective hiccup within a developing downtrend that could have significant losses still ahead.
These issues considered, scalpers are OK to approach this market from a cautious bullish perspective with a failure below 2728 required to negate this call and reinstate the broader bear. Short- and longer-term traders however remain advised to first approach this pop as a correction within the broader downtrend with a recovery above 2894 required to threaten this count enough to warrant paring or neutralizing bearish exposure. In effect we believe the market has identified 2894 and 2728 as the key directional triggers heading forward. Toggle directional biases and exposure around this range.


