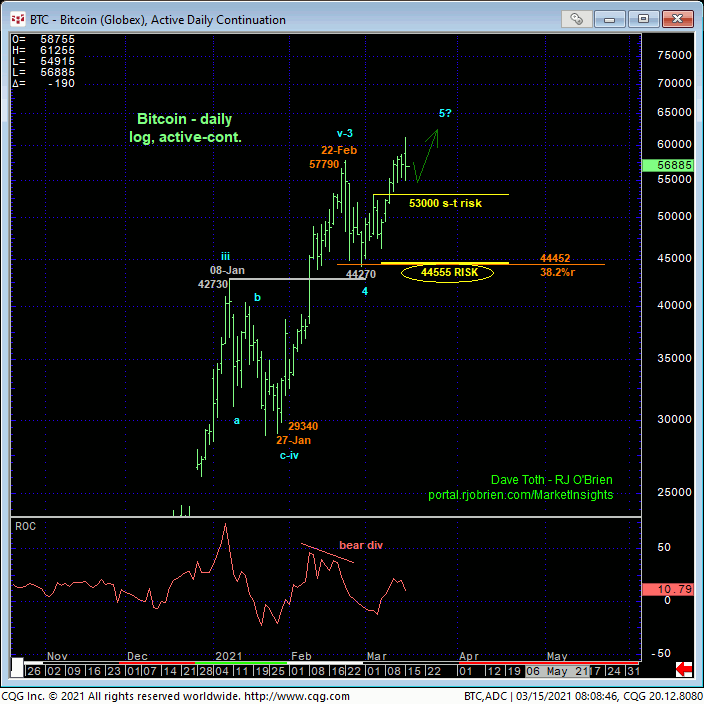

Despite a bearish divergence in very short-term momentum, the end of last week and overnight’s break above 22-Feb’s 58620 high reaffirms and reinstates the secular bull trend and confirms 26-Feb’s 44555 low as the larger-degree corrective low this market is now required to fail below to confirm a bearish divergence in momentum of a scale sufficient to threaten the major bull. Per such, this 44555 level serves as a our key long-term risk parameter from which longer-term institutional players can objectively rebase and manage the risk of a still-advised bullish policy and exposure.
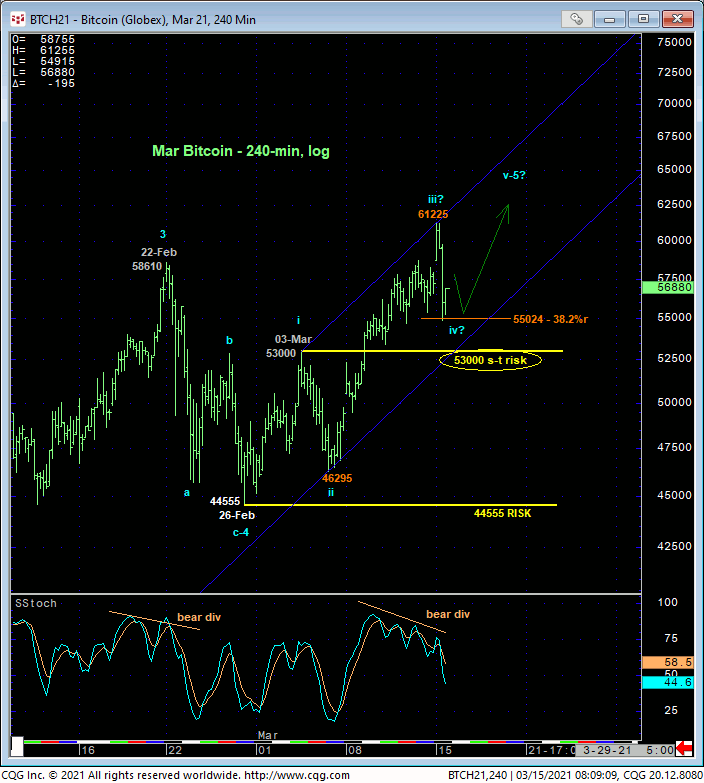
From a shorter-term perspective, the 240-min chart above shows the bearish divergence in very short-term momentum. But against the backdrop of the secular bull trend this setback is advised to first be approached as a smaller-degree (prospective 4th-Wave) correction within the portion of the rally from 26-Feb’s 44555 low as labeled above. Indeed, this setback as thus far retraced a Fibonacci minimum 38.2% of the (suspected minor 3rd-Wave) rally from 05-Mar’s 46295 low to today’s 61225 high and remains above 03-Mar’s 53000 high and suspected minor 1st-Wave that it needs t remain above to maintain its trendy, impulsive integrity required of a more immediate bullish count. In this short-term regard then, this 53000 level serves as our short-term risk parameter from which shorter-term traders with tighter risk profiles are advised to rebase and manage the risk of a still-advised bullish policy and exposure.


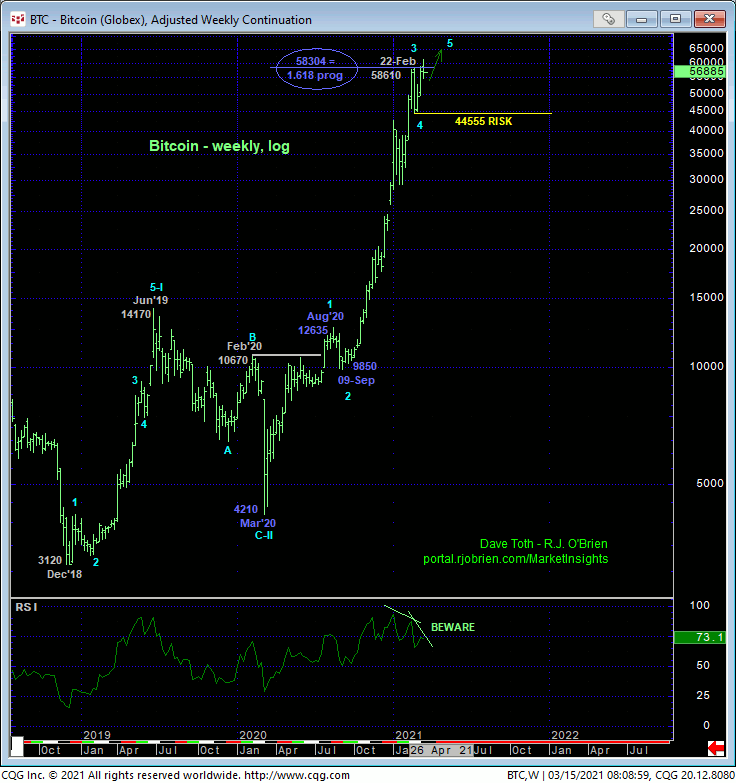
From a very long-term perspective, few aren’t wondering how long and to what heights this bull can travel. The answer is, of course, there is no way to know. The ONLY thing that matters at this time is MOMENTUM. Quite simply, this means the bulls ability to sustain trendy, impulsive behavior above a prior corrective low. A failure, for instance, below 26-Feb’s 44555 larger-degree corrective low will, in absolute fact, break the uptrend from at least 27-Jan’s 29340 low and possibly complete a major 5-wave Elliott sequence from Mar’20’s 4210 low as labeled in the weekly log scale chart above. The nicely developing POTENTIAL for a bearish divergence in WEEKLY momentum is clear. A failure below 44555 twill CONFIRM this divergence, break the major uptrend and expose a correction or reversal lower that could be extensive and with indeterminable scope.
While merely “derived technical levels mean nothing to s in the absence of such a confirmed bearish divergence in momentum needed to break the clear and present uptrend, we still find it interesting that the bull trend has found the upside going a little tougher around the (58304-area) 1.618 progression of Mar-Aug’20’s 4210 – 12635 1st-Wave rally from 09Sep20’s 9850 (2nd-Wave) corrective low.
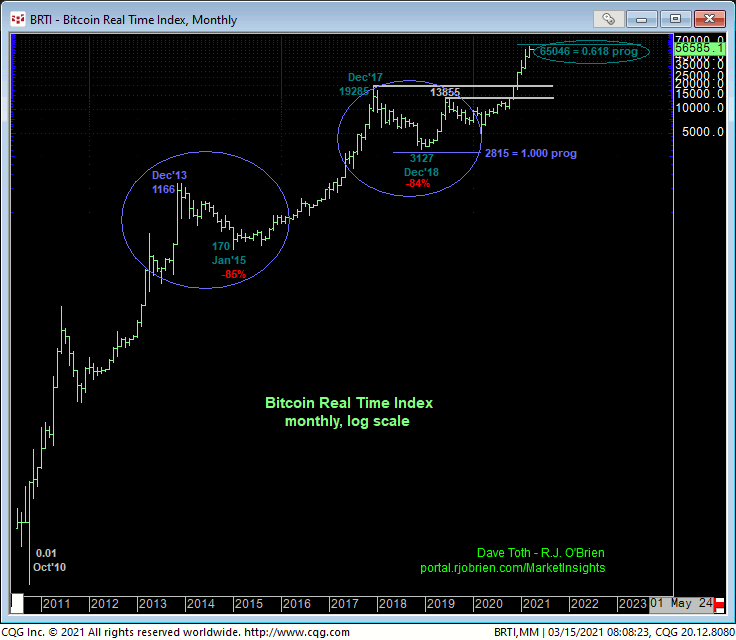
Additionally, looking at the monthly log scale chart below of the underlying Bitcoin Real Time Index, we find it even more interesting that the resumed secular bull trend from Dec’18’s 3127 low is within spittin’ distance of the (65046) 0.618 progression of Jan’15 – Dec’17’s preceding 170-to-19285-portion of the bull. Keep in mind, this is on a log scale basis and follows a major 84% correction from Dec’17’s 19285 high to Dec’18’s 3127 low that came within spittin’ distance of the (2815) 1.000 progression of the preceding major 85% correction from Dec’13’s 1166 high to Jan’15’s 170 low. So there is certainly Fibonacci progression relationship precedence going on in this market. Nonetheless, NO merely “derived” technical level like trend lines, Bollinger Bands, imokus, the ever-useless moving averages or even our vaunted Fibonacci relationships mean a thing without an accompanying confirmed bearish (in this case) divergence in momentum. And this take us back to that simple larger-degree corrective low and key risk parameter a 44555.
In sum, a bullish policy and exposure remain advised for long-term players with a failure below 44555 required to threaten this call enough to warrant moving to a neutral/sideline position to circumvent the depths unknown of a correction or reversal lower that could be major in scope. Shorter-term traders remain advised to maintain a bullish policy with a failure below 53000 required to neutralize exposure. In lieu of such weakness, further and possibly accelerated gains remain expected.


