The third week of June continued the increased volatility across the major Indices, displaying mixed sentiment across the charts. And as this week starts, there are some signs of technical divergence that may imply that the uncertainty may continue this coming week. The US Dollar Index closed higher, but just below 98.00, not seeming to be done with its move towards 98.00 yet, and is still operating within a larger range, implying shorter-term trends are a possibility.
Civil unrest is continuing in major cities with no apparent signs of abating any time soon. Several issues are tied to the protests that are unlikely to be resolved until after the November elections.
The Coronavirus infection rate has aggressively spiked in direct correlation to states that re-opened combined with crowd gatherings, resulting in a significant single weekly leap to reach 2.3 million infected and 122,000 recorded deaths as at the time of writing. This is the highest rate achieved since 1 May 2020 and is still considered part of the first wave.
As we head into the next week of June 2020, key economic calendar news events to watch out for this week may be:
● Home sales – Monday and Tuesday.
● Crude Oil inventories – Wednesday.
● Initial Jobless Claims – Thursday.
The indices continue to show increased volatility, with mixed bullish and bearish price action. It could be prudent to observe from the side lines again for the next week.
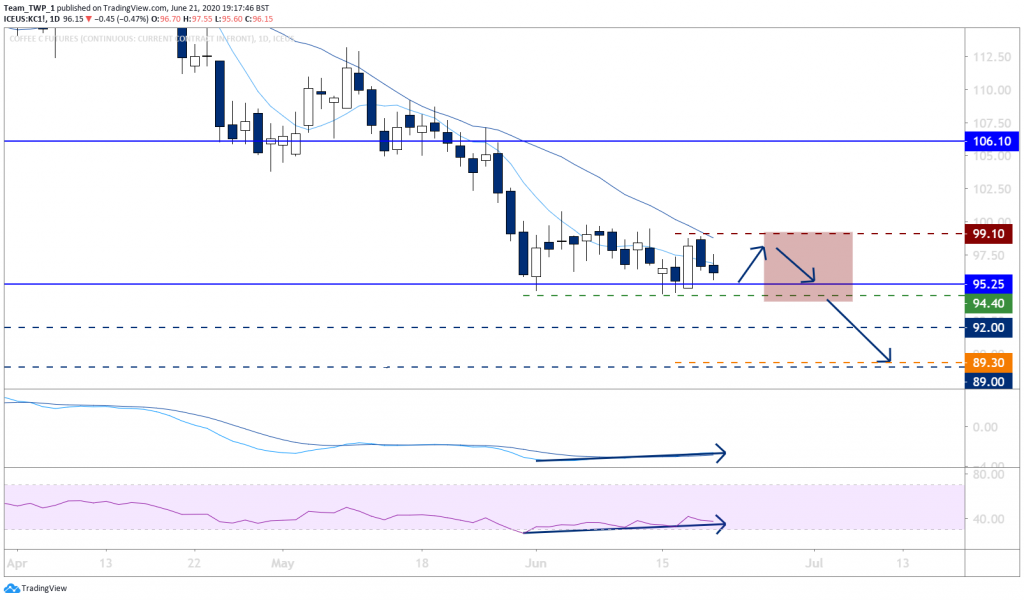
KC, Coffee, Daily, Bearish
The weekly and daily charts have a clear downtrend with lower-highs and lower-lows.
The moving averages (MAs) are in bearish angle, order and separation, with both momentum indicators on the weekly heading lower and supporting bearish sentiment, but some bullish divergence on the daily that may play out before the trade idea is triggered.
Price appears to be testing support around 95.00 and may be preparing to break lower within the next few sessions.
Importantly, should price bounce upwards, above the swing-high of 3 June at 100.75, before breaking lower, the trade may become invalidated.
The area highlighted in red is an area where a bearish entry signal may provide an opportunity to join the downtrend if it resumes.
Should price break below 95.00, an entry signal may be presenting itself at 94.40.
Placing the stop-loss at that time behind the most recent swing-high, and/or above 99.00 – 100.00 may provide additional stop-loss protection. Traders may consider taking partial profits at a 1:1 target to mitigate risk.
89.00 appears to be the next key level and may be a reasonable target for final profits. Risk management will be key, so a stop-loss is imperative, in order to protect capital exposure against unforeseen outcomes.
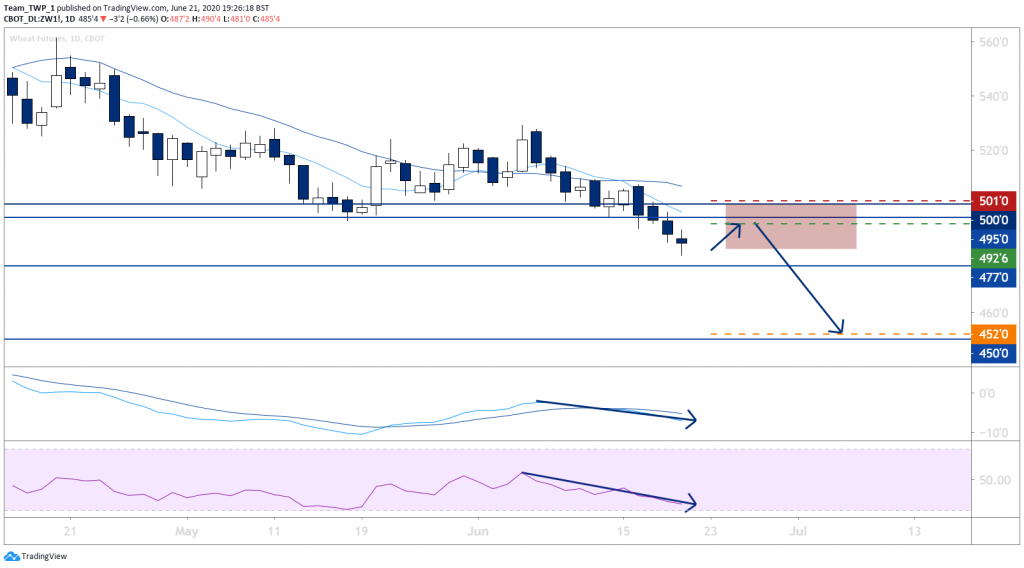
ZW, Wheat, Daily, Bearish
The weekly and daily charts have a clear downtrend with lower-highs and lower-lows.
The MAs are in bearish angle, order and separation, with both momentum indicators heading lower supporting bearish sentiment.
Price has recently broken support and headed below 500.00 and may retrace in the coming week back up into the MAs and/or test 500 for resistance.
The area highlighted in red is an area where a bearish entry signal may provide an opportunity to join the downtrend if it resumes.
Should price produce a small bearish candle in this area, it may provide an entry opportunity if the subsequent session breaks the low of this bearish signal candlestick.
Placing the stop-loss at that time above the high of the candle, and/or above 500.00 – 501.00 may provide additional stop-loss protection.
Traders may consider taking partial profits at a 1:1 target to mitigate risk.
450.00 appears to be the next significant level and may be a reasonable target for final profits.
Risk management will be key, so a stop-loss is imperative, in order to protect capital exposure against unforeseen outcomes