FEB HEATING OIL
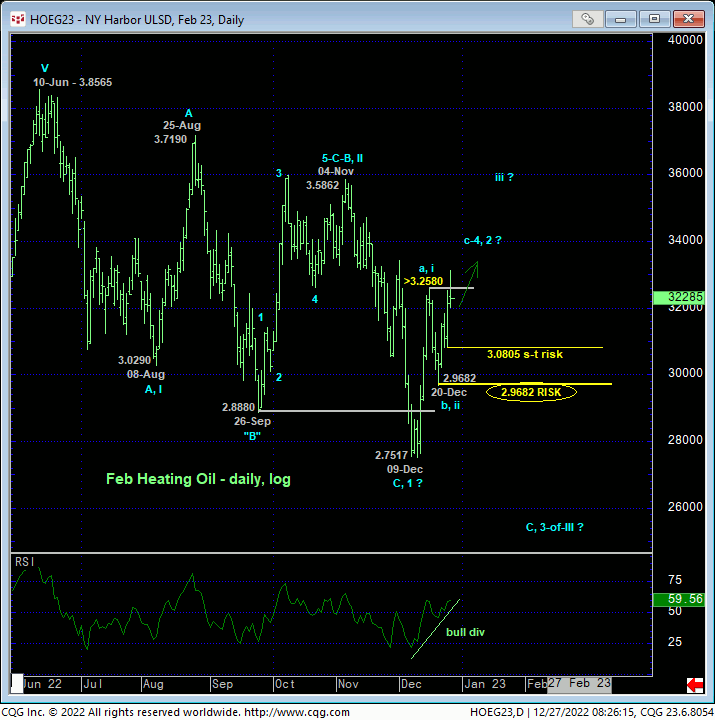
Overnight’s recovery above 15-Dec’s 3.2580 initial counter-trend high and our key bear risk parameter in the now-prompt Feb contract confirms a bullish divergence in daily momentum and is sufficient to threaten a broader bearish count enough to warrant a move to the sidelines by longer-term commercial players. For longer-term reasons we’ll discuss below, this month’s recovery remains of an insufficient scale to conclude the end of this year’s major reversal lower, but it IS sufficient to define 20-Dec’s 2.9682 low as a corrective low the market is now minimally required to relapse below to mitigate a more immediate bullish count and resurrect a longer-term bearish count. Until and unless such sub-2.9682 weakness is proven, at least the intermediate-term trend is up ahead of potentially steep gains. Per such, we’re identifying 2.9682 as our new longer-term risk parameter from which commercial players can objectively base non-bearish decisions like short-covers and cautious bullish punts.
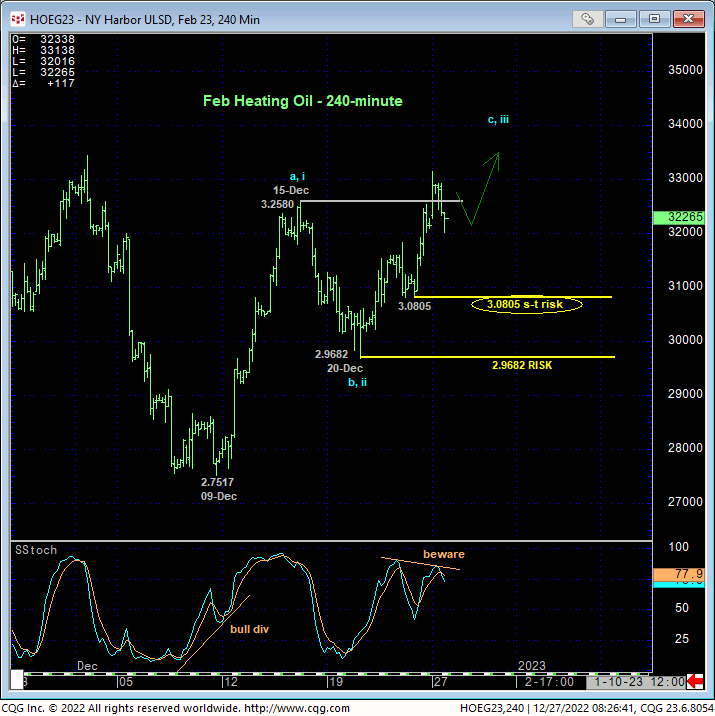
On a shorter-term scale, the 240-min chart below shows Fri and overnight’s continued recovery leaving Fri’s 3.0805 low in its wake as the latest smaller-degree corrective low this market is now required to sustain gains above in order to maintain a more immediate bullish count. Its failure to do so would jeopardize the impulsive integrity of a more immediate bullish count and tilt directional scales back to the bear side. Per such, we’re defining 3.0805 as our new short-term risk parameter from which shorter-term traders with tighter risk profiles can objectively rebase and manage the risk of non-bearish decisions like short-covers and cautious bullish punts.
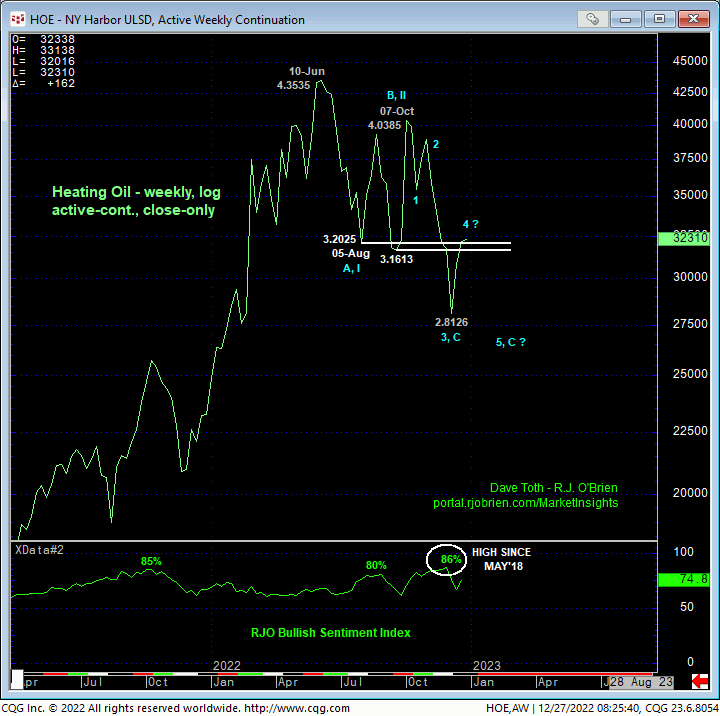
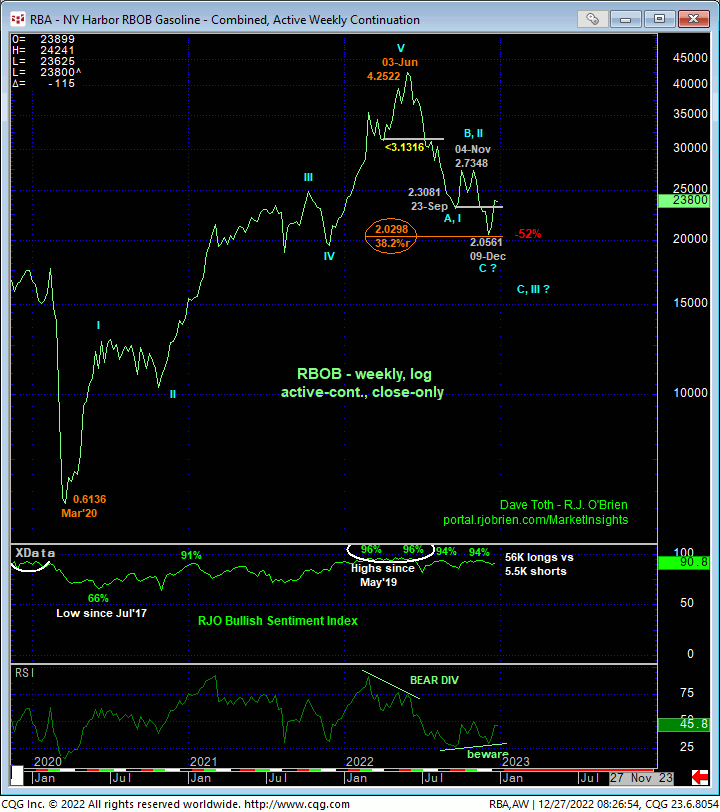
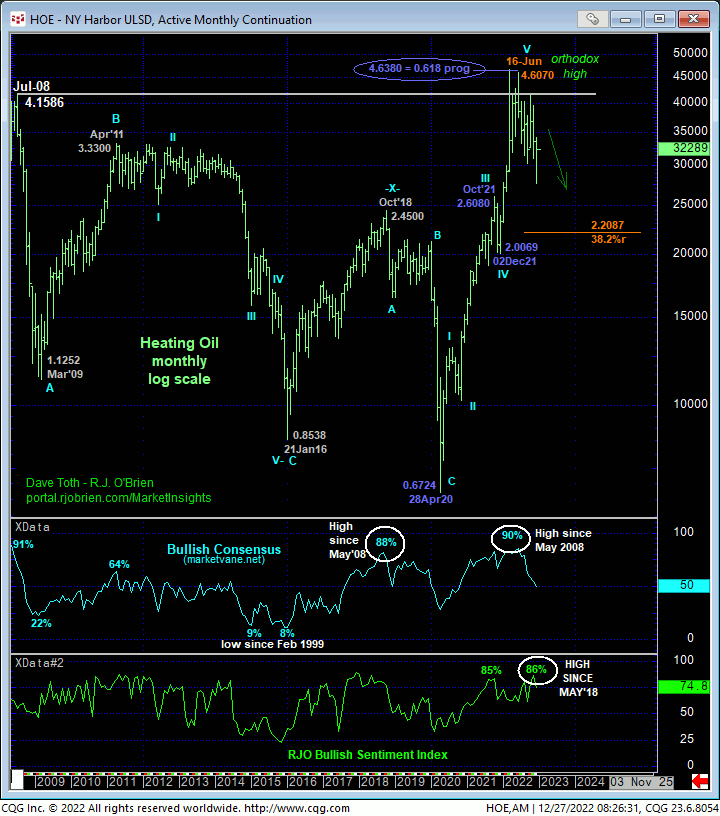
On a much longer-term basis however, the weekly log close-only chart of the most-active contract (above) and monthly log active-continuation chart (above) still show elements typical of a major peak/reversal process:
- a confirmed bearish divergence in momentum amidst
- historically extreme bullish sentiment/contrary opinion levels
- a textbook complete and massive 5-wave Elliott Wave sequence from Apr’20’s 0.6724 low to Jun’22’s 4.6070 orthodox high, and
- the market’s gross failure to sustain the summer’s break above 2008s former all-time high of 4.1586.
Early-Dec’s break and weekly close below a ton of former support from Aug-Sep around the 3.20-area confirms the long-term trend as down and also identifies this former support area as a key new resistance candidate. To negate this major peak/reversal count, this market is required to prove commensurately larger-degree strength above Oct’s 4.0385 corrective high weekly close to render Jun-Dec’s entire sell-off attempt a 3-wave and thus (major 4th-Wave) corrective structure that would then re-expose the secular bull market.
Herein lies the importance of recent but important smaller-degree corrective lows and bull risk parameters identified at 3.0805 and especially 2.9682. For IF this market is resuming the secular bull market, it would fully be expected to BEHAVE LIKE A BULL by sustaining trendy, impulsive, increasingly obvious behavior to the upside. Its failure to do so by relapsing below 3.0805 and 2.9682 would be inconsistent with such an alternate bullish count and reinforce a count calling this month’s recovery attempt another correction within the new secular bear market.
These issues considered, traders have been advised to move to at least a neutral/sideline position in order to circumvent the heights unknown of a suspected correction higher within a broader bear trend. A relapse below 3.0805 will threaten this interim bullish count while commensurately larger-degree weakness below 2.9682 will render the recovery from 09-Dec’s 2.7517 low a 3-wave and thus corrective event and re-expose the new major bear trend. In lieu of weakness below these levels and/or a recovery-stemming bearish divergence in short-term momentum in the week or two ahead, further lateral-to-higher prices are anticipated for the time being.
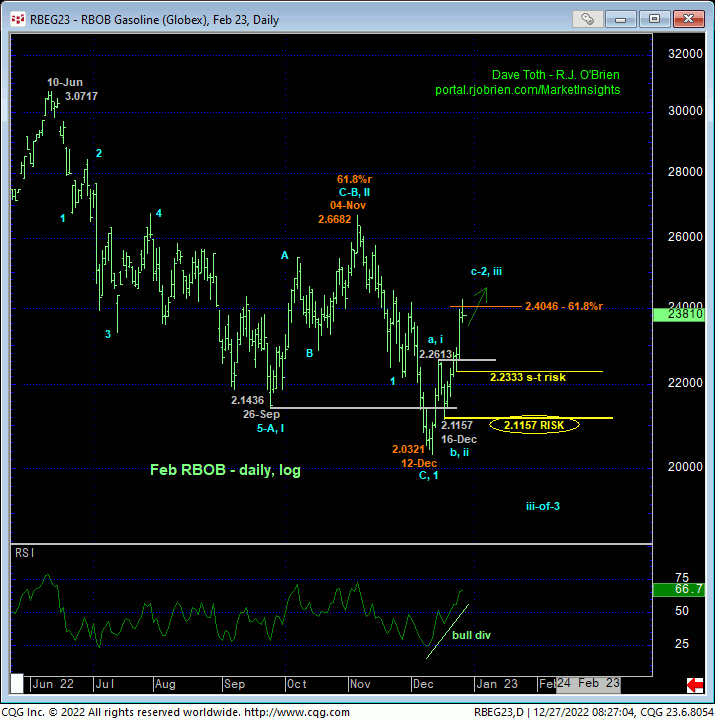
FEB RBOB
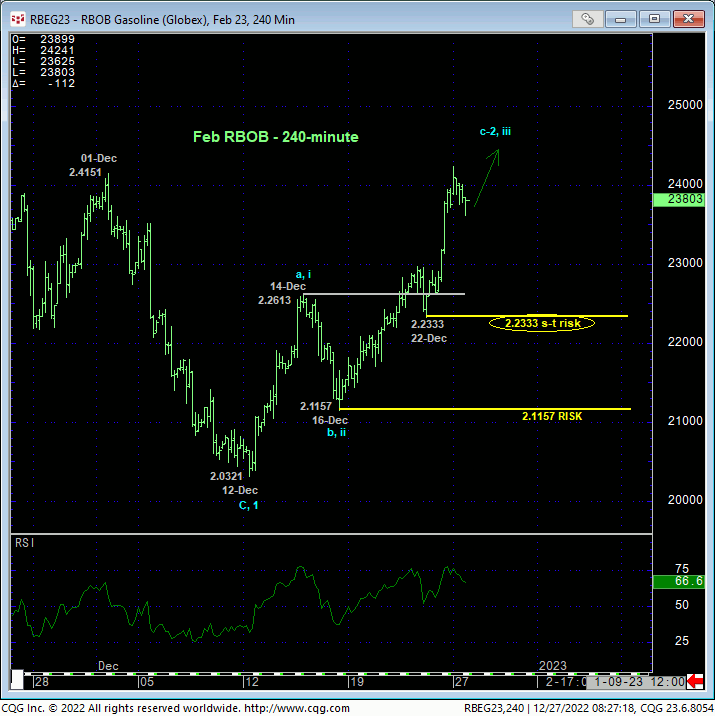
By recovering above our key bear risk parameter defined by 01-Dec’s 2.4151 larger-degree corrective high, the technical construct and expectations for the now-prompt Feb RBOB contract are identical to those detailed above in Feb heating oil with recent smaller- and larger-degree corrective lows at 2.2333 and 2.1157 considered our new short- and long-term risk parameters from which non-bearish decisions like short-covers and cautious bullish punts can be objectively based and managed. Against this year’s major peak/reversal process and especially given still-frothy bullish sentiment/contrary opinion levels, the past couple weeks’ recovery is advised to first be approached as another correction and eventual selling opportunity. But until/unless this recovery is arrested by a countering bearish divergence in momentum and/or a failure below these new bull risk parameters, the market’s upside correction potential is considered indeterminable and potentially extensive. Per such, a neutral/sideline policy is advised for the time being.
