In the penultimate week of March, traders are likely to be keeping an eye on Crude Oil, New Home Sales, Core Durable Goods Orders and GDP. Globally, we have Manufacturing PMI, Retail Sales, and CPI in the UK, with only Manufacturing PMI and EU headlining the European scheduled news.
Of course, the very real danger of COVID-19 is now already impacting all of us in some way, with the most striking change to our normal lifestyles being the shift to working from home for many people. The full impact of this on our economies is yet to be seen. No doubt prevention is better than cure, and it would be prudent to be extra cautious.
The sentiment appears to be bearish, and several charts show potential signs of overdue corrections, and so it’s possible this coming week may show some signs of temporary recovery or retracement in prevailing trends.
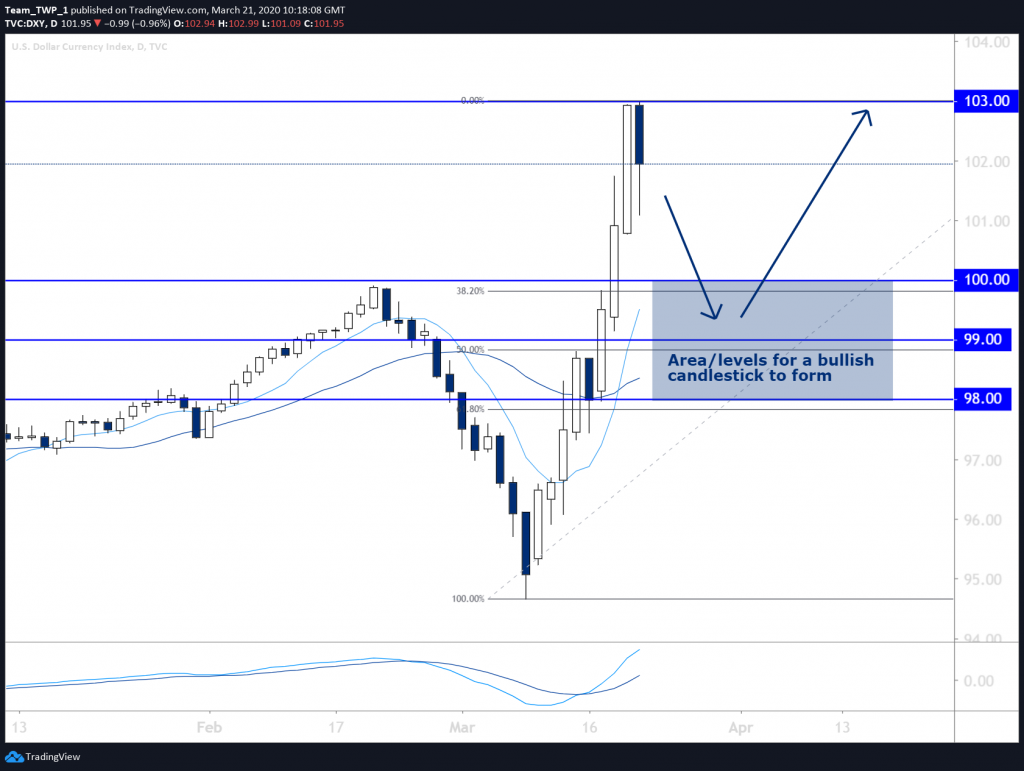
It’s worth mentioning that the US Dollar Index broke up through 100, reaching a high of 103, before settling at 101.95 for the week. This, after a bold swing from fresh lows at the start of the week. The implication being that the USD may be looking to continue strengthening this week.
US Dollar Index (DXY), Bullish, Daily
Both the Monthly candlestick and recent Weekly candlesticks are quite bullish in shape, and also engulfing a lot of recent bearish price action. This is an unusual sign of potential shift to bullish sentiment.
Retracements or dips in the current upwards move may offer entry opportunities into the prevailing trend.
Key support and resistance levels close to price here are 100, 99 and 98, all of which are close in proximity to Fibonacci levels, if price retraces from where it is now. The 100 level is significant historically and psychologically, as well as having been a key level in recent years, as has 103.
The moving averages (MAs) and momentum indicators are in line with price action’s moves, supporting the bullish sentiment.
Should price retrace to any of these key levels and produce a bullish candle, an entry into the trend could present itself if it resumes.
A stop-loss below 98 may add additional technical protection.
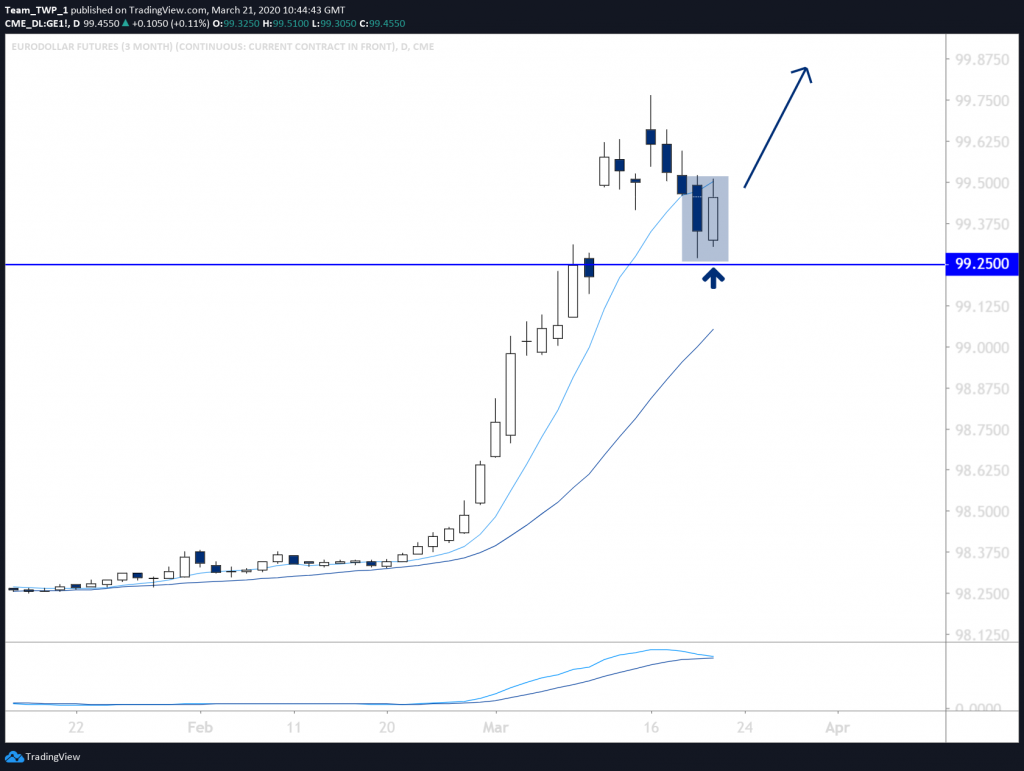
Eurodollar, Bullish, Daily
It’s less common to see both a bullish DXY and a bullish Eurodollar, but the charts are indeed technically at least indicating an intent to attempt to climb higher in the near future in both cases.
The monthly, weekly and daily charts have all been trending upwards for several weeks and are arguably over-extended, with a longer than average candle on the monthly, and a sellers’ candle on the weekly chart, which could indicate a possible weekly retracement on the horizon. That said, moves in the current climate recently have been relentless, and this may continue to be the case.
Should price this coming week break above the bullish candle that has formed in the MAs, it could indicate that the market is going to maintain the trend.
A stop-loss below the prior candle and/ or below the level of 99.25 could add additional technical protection. Profit may be taken at regular intervals to mitigate risk further.
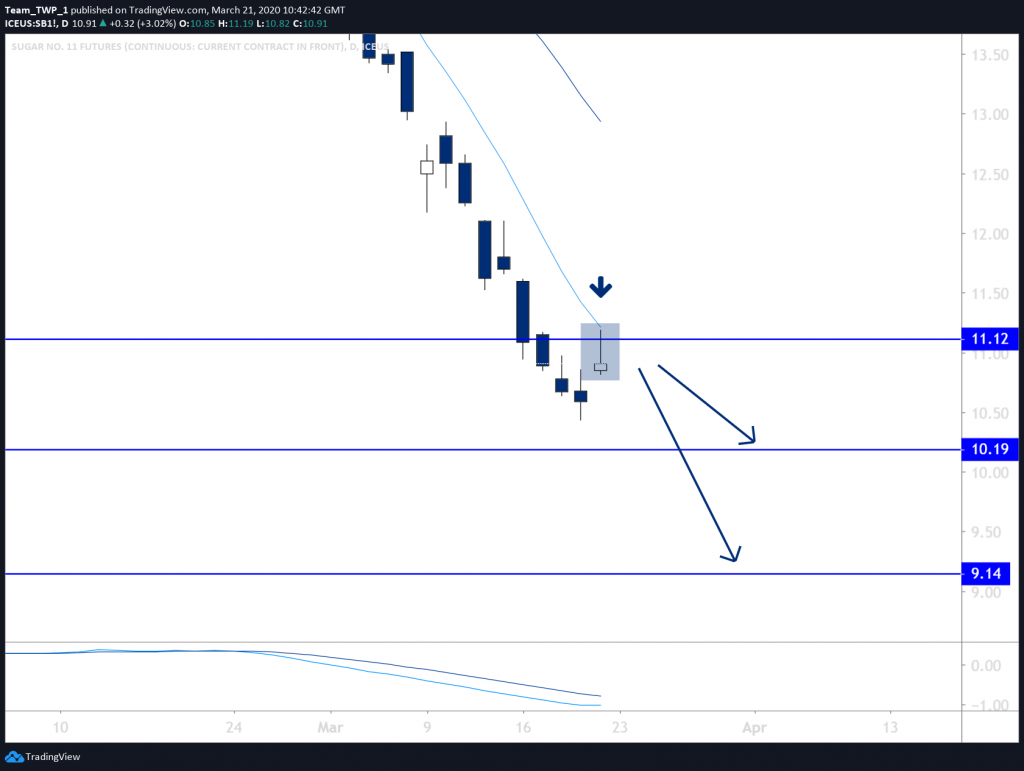
SUGAR No.11, Bearish, Daily
This is a chart that has also been moving relentlessly with little or no technical retracements until now.
It has just returned towards the MAs and produced a well- shaped bearish rejection candlestick up against a historical level or support and resistance.
Should price in the coming week break below the low of this bearish candle, it may maintain the downward trend towards lower levels 10.19 and 9.14 respectively.
Risk management will be key, so ensure you have a risk management plan. A stop-loss is imperative in order to protect capital exposure against unforeseen outcomes. A stop-loss placed above the high of the candlestick and above the 11.12 level could add additional protection. Taking profits if the moves are in the prevailing direction may mitigate risk further. And taking partial profits should the trade be triggered could also mitigate risk.