Posted on Nov 17, 2022, 05:49 by Dave Toth
In yesterday’s T-Note Technical Blog we discussed the confluence of technical facts that warn of a developing base/reversal threat that could be major in scope. With overnight’s break above 27-Oct’s 140.92 initial counter-trend high, the bund market has joined this base/reversal-threat club that warns of further and possibly extensive gains in the weeks and possibly months ahead.
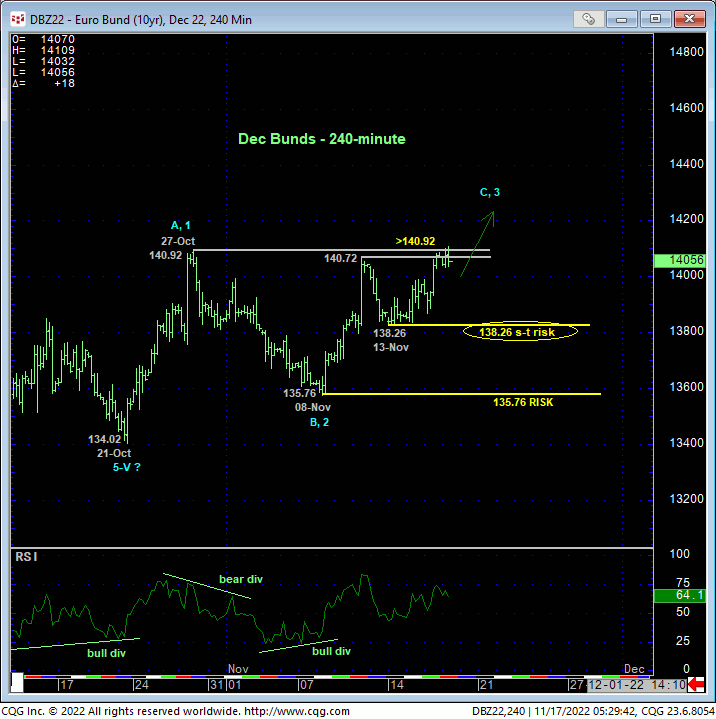
Beginning with a shorter-term scale, the 240-min chart below shows overnight’s break above both last week and 27-Oct’s 140.72-to-140.92-area resistance. As we’ll discuss further down, this strength confirms a bullish divergence in daily momentum that breaks Aug-Oct’s broader downtrend. The important by-products of this larger-degree proof of strength are the market’s definition of smaller- and larger-degree corrective lows at 138.26 and 135.76 that this market is fully expected and now required to sustain trendy, impulsive gains above per any broader bullish count. Its failure to do so will threaten and then confirm the recovery from 21-Oct’s 134.02 low as a 3-wave and thus corrective affair that would re-expose the secular bear trend. Until and unless such weakness is proven, we cannot ignore the prospect that the developing rally from 08-Nov’s 135.76 low is the dramatic and extensive 3rd-Wave of a major correction or reversal higher. Such a count warns of steep, sharp, sustained gains straight away. Per such, these levels serve as our new short- and long-term parameters from which the risk of non-bearish decisions like short-covers and new bullish punts can be objectively based and managed.


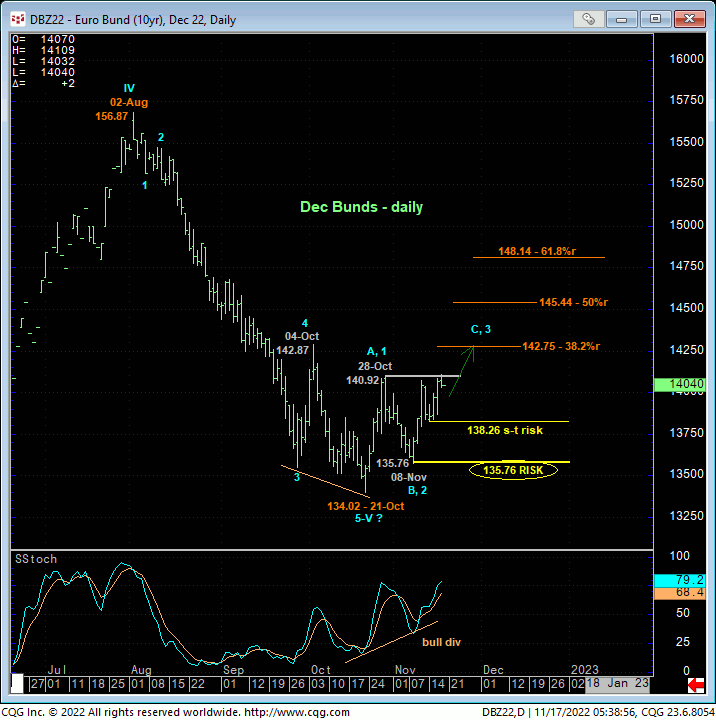
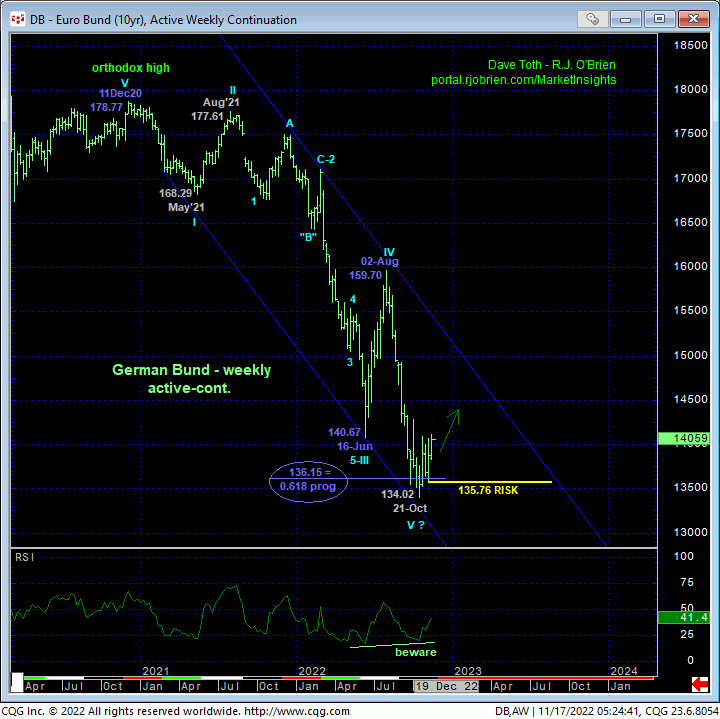
On a broader scale, the daily chart above shows overnight’s break above 28-Oct’s 140.92 initial counter-trend high. This confirms a bullish divergence in DAILY momentum that raises the odds that 21-Oct’s 134.02 low COMPLETED a 5-wave Elliott sequence down from 02-Aug’s 156.87 high and that this current recovery is AT LEAST a correction of Aug-Oct’s entire 156.87 – 134.02 decline where even the Fibonacci minimum 38.2% retrace doesn’t cut across until the 142.75-area. And when you factor in the prospect that last month’s 134.02 low MIGHT have completed a massive 5-wave sequence down from Dec’20’s 178.77 high as labeled in the weekly chart below, the risk/reward metrics of non-bearish decisions become even more attractive.
Of course, given the magnitude of a nearly two-YEAR major reversal of a decades-long secular bull market, commensurately larger-degree proof of base/reversal behavior is warranted before any longer-term bullish conclusions can be drawn. However, it is not premature to identify levels like 138.26 and 135.76 as the new risk parameters this market now needs to relapse below to threaten and then negate an aspiring bullish count.
These issues considered, a bullish policy remains advised for shorter-term traders with a failure below 138.26 required to warrant a move to a neutral/sideline position. Longer-term institutional players are advised to neutralize any remaining bearish exposure and move to a cautious bullish stance at current 140.55-area prices OB with a failure below 138.26 required to pare exposure to more conservative levels and subsequent weakness below 135.76 required to neutralize remaining exposure. In lieu of such weakness, further and possibly protracted gains straight away should not surprise.


