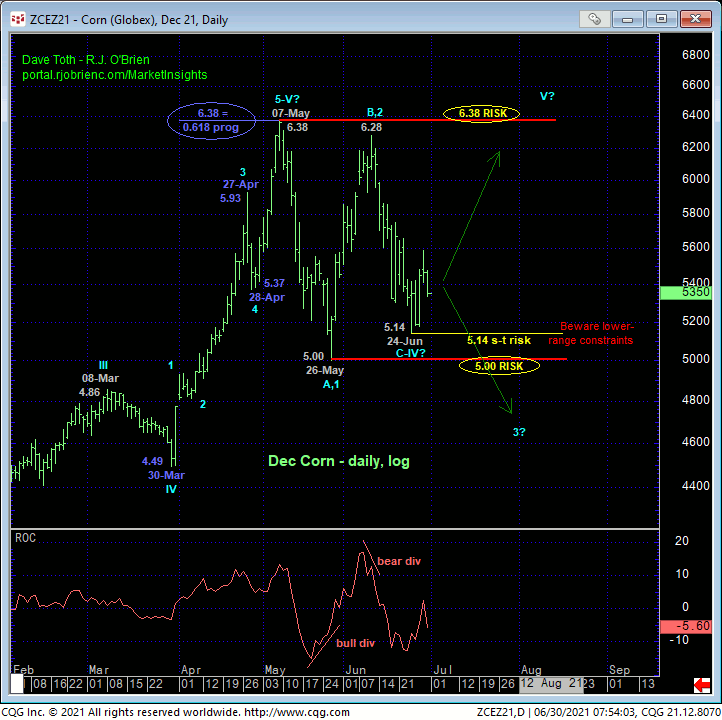
In yesterday’s Trading Strategies Blog we discussed the combination of a bullish divergence in very short-term momentum from the lower recesses of the past couple months’ range as a favorable risk/reward condition from which to take a cautious but favorable risk/reward punt from the bull side via the Aug Short-Date 5.80 / Dec 6.80 call Diagonal Spread. We don’t need to rehash here again the longer-term technical debate of whether this month’s slide from 10-Jun’s 6.28 high is the completing C-Wave of a major bull market correction or the dramatic 3rd-Wave down of a major reversal lower. We’ve discussed this a number of times since May’s (A- or 1st-Wave) plunge as well as the past month’s 5.14-to-5.00-area support that, if broken, would reinforce the bearish count and expose potentially long-term losses.
For traders looking for a cautious but favorable risk/reward bet on the bearish outcome that, presumably, could be fueled by this morning’s key crop report, we recommend a similar but inverted put diagonal strategy below.

BEAR SPEC: AUG SHORT-DATED 5.10 / DEC 4.60 PUT DIAGONAL
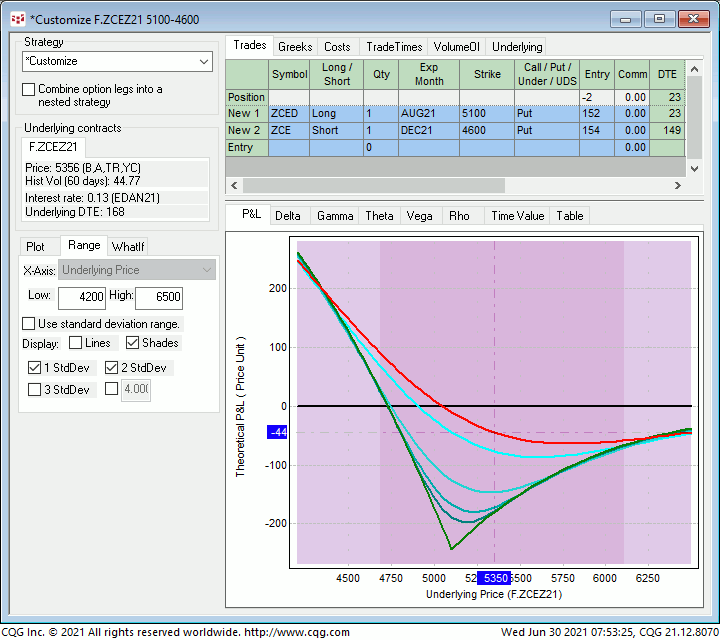
This strategy involves buying the Aug Short-Dated 5.10 Puts around 15-1/4-cents and selling the Dec 4.60 Puts around 15-1/2-cents for an initial cost of about “even”. This strategy provides:
- a current net delta of -5%
- OK gamma ratio of 2:1 (this is because there’s still more than three weeks until expiration of the Aug short-dated puts; we typically prefer this ratio to be above 3:1)
- negligible risk if the market explodes upward in a 5th-Wave to new highs
- profit potential of $0.50-cents on a sustained 3rd-Wave meltdown below 5.00.
As always with long-gamma diagonal plays, merely lateral price action is its worst enemy as theta risk is greater in the closer-to-the-money, near-term option. If the underlying dec contract doesn’t MOVE sharply in the week ahead, this strategy should be covered for what should be a small loss.
Traders are also advised to focus on the red P&L line and the first light blue P&L line in the graph below. These lines reflect this spread’s performance today and a week from today. The blue and green lines further down reflect this strategy’s performance over time and then at expiration (green line). Per the current technical construct as well as today’s potentially-market-moving key crop report, this strategy is predicated on a sharp, sustained move down in the week immediately ahead. If the market doesn’t comply, this trade is best covered by this Fri before the long holiday weekend where time decay does not help.


