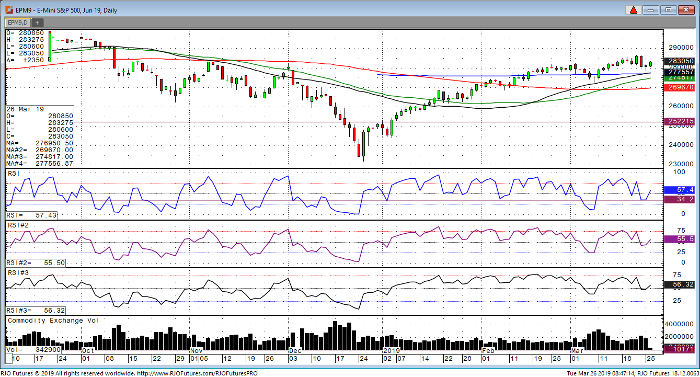
We have had a pickup in volatility as treasuries around the globe have plummeted in the last week in both Europe and the U.S. The main driver for this move is fear of a global slowdown. What we witnessed here is been something we have not seen since the 2007-2008 year where the curve has inverted. What I mean is that the 3-month T-bill is yielding higher than the 10-year note. Most pundits believe when this happens it is often a precursor to a recession that usually occurs 6-9 months after inversion. So, it’s very important for traders to continue to watch the bond curve as this should give direction of stocks for the foreseeable future. Coming into today, stocks have a bid to them as yields have stabilized. As you look at the charts there has been some damage done short term on the equity indexes with the Russel 2000K behaving the weakest of the group with price action currently below the important 200 day moving average. Looking at technical in the S&P E-mini, resistance comes in 2850-2860 level, and support coming in at yesterday’s low 2789. A break of support should lead to a quick test of the 200-day moving average which currently lies at 2769.00. Traders should continue to watch Treasuries for near term direction in stocks.
E-Mini S&P 500 Jun ’19 Daily Chart


