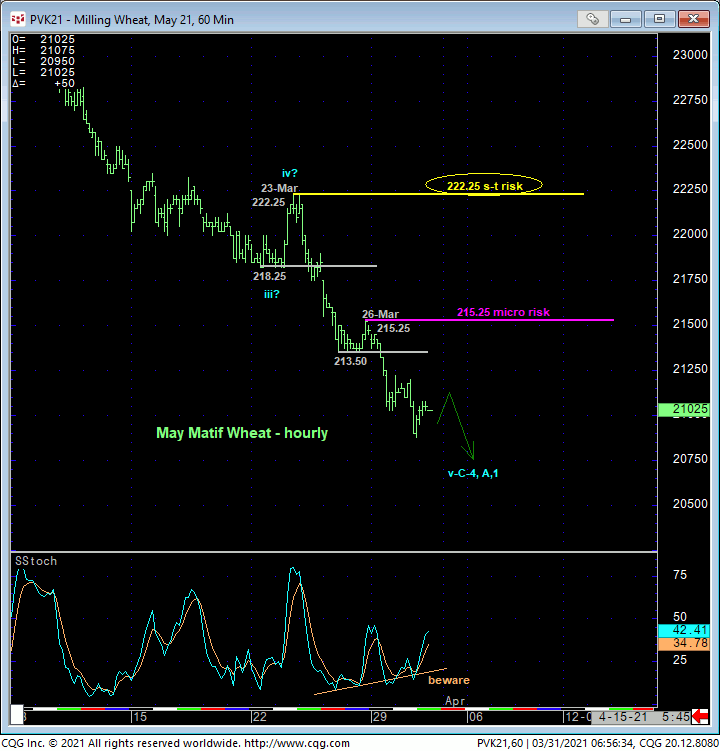
This week’s continuation of the major reversal below last week’s 213.50 lows and support obviously reinforces our major peak/reversal count introduced in 05-Mar’s Technical Blog, but also leaves last Fri’s 215.25 high in its wake as a smaller-degree corrective high from which we can now more deftly navigate a more immediate bearish count. In this regard, this 215.25 level serves as our new micro risk parameter from which shorter-term traders with tighter risk profiles can objectively rebase and manage the risk of a still-advised bearish policy and exposure.

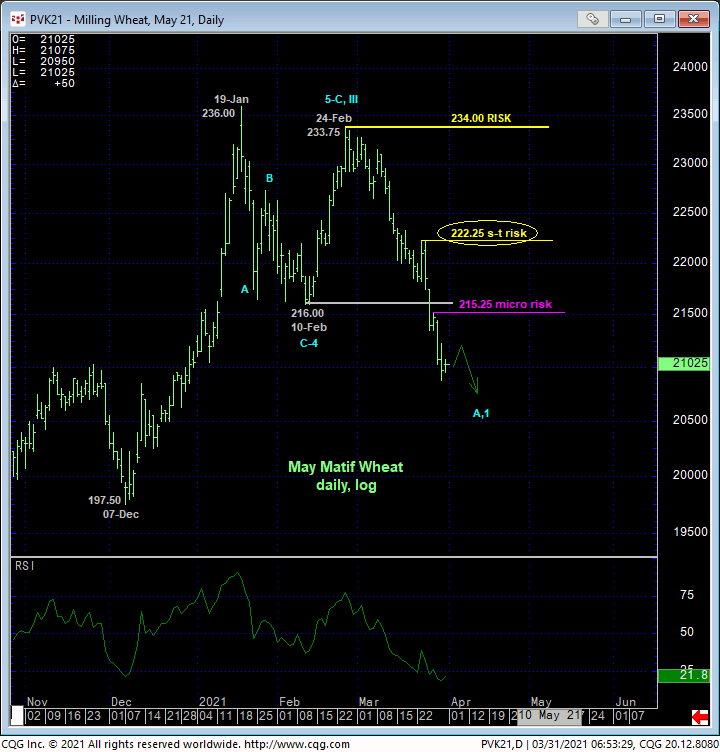
Stepping back a bit to consider the past month’s developing meltdown on a daily basis below, it is clear that a recovery above 215.25 would be of an insufficient scale to conclude the end of the downtrend from 24-Feb’s 233.75 high. Indeed, a recovery above at least 23-Mar’s 222.25 next larger-degree corrective high remains required to conclude the end of what we suspect is just the initial (A- or 1st-Wave) of a major correction or reversal lower. While commensurately larger-degree strength above our 234.00 long-term risk parameter remains required to reinstate the secular bull, even longer-term commercial players can utilize this 222.25 intermediate-scale corrective high as an objective risk parameter to a bearish policy in order to circumvent the heights unknown of a more extensive (B- or 2nd-Wave) corrective rebuttal or a (major 5th-Wave) resumption of the secular bull trend. In lieu of strength above at least 215.25 and preferably 222.25, the trend is down on al practical scales and should not surprise by its continuance or acceleration.

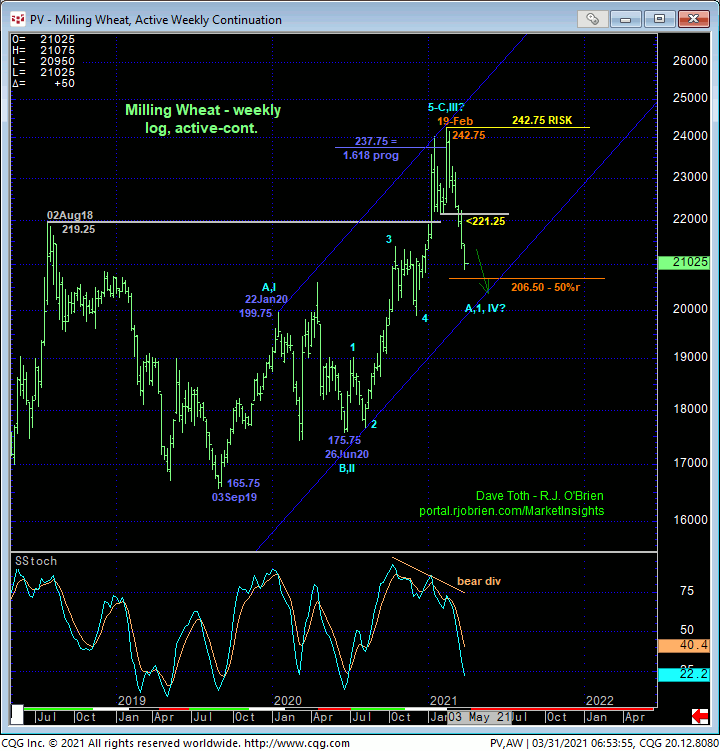
Stepping back even further, the weekly log active-continuation chart below shows that Jun’20-to-Feb’21’s 175 – 242 rally is so massive that we cannot ignore an ultimately-still-bullish count that would contend that the past month’s relapse is “just” a major 4th-Wave correction within an even more massive 5-wave Elliott sequence dating from Sep’19’s 165 low. Indeed, the past month’s relapse remains well within the bounds of the six-quarter up-channel as is only now encroaching on the (206.50) 50% retrace of Jun’20 – Feb’21’s 175.75 – 242.75 (prospective 3rd-Wave) rally.
As with many of the recent peak/reversal-threat developments across the entire ag sector and as just updated in this morning’s Canola Technical Blog, one would be hard pressed to find any major reversal PROCESS that dd not include and often times extensive- in terms of price and time- (B- or 2nd-wave or right-shoulder) corrective rebuttal to the initial counter-trend break like this wheat’s past month’s meltdown. And herein lies the importance of recent smaller-degree corrective highs and risk parameters like 215.25 and certainly 222.25. But until and unless the market even threatens, let alone breaks the current clear and present downtrend, its remaining downside potential is indeterminable and potentially extreme.

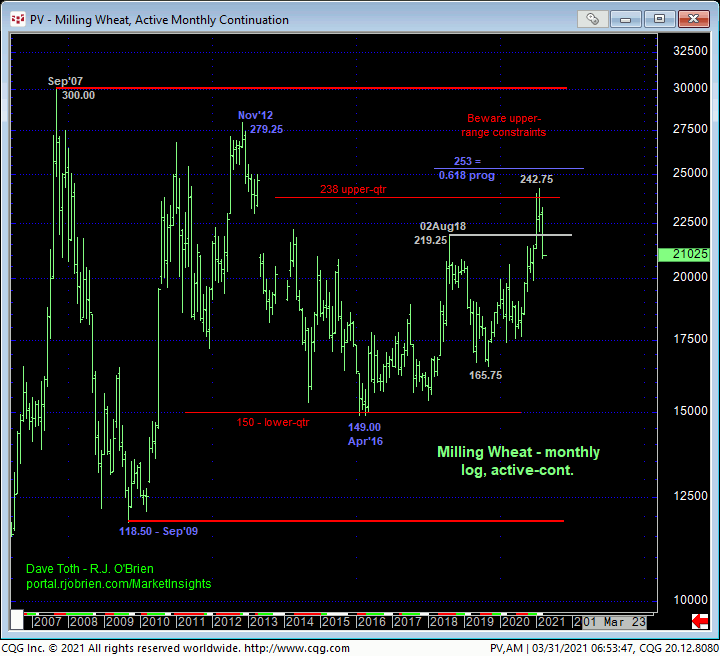
Finally and from an even longer-term perspective, the monthly log scale chart below shows the market’s recent poke into the upper-quarter of its massive historical lateral range over the past 14 years where it has had little success in sustaining gains and where the risk/reward merits of maintaining a bullish policy are highly questionable. Against the backdrop of what is basically a FOUR YEAR uptrend from Apr’16’s 149.00 low, the past month’s “meltdown” is a relative hiccup that precludes us from concluding the end to this four year bull. But for the reasons detailed above and until this market can recoup levels above at least 222.25 and especially 24-Feb’s 233.75 high, a bearish policy and exposure remain advised ahead of what could be protracted losses straight away.


