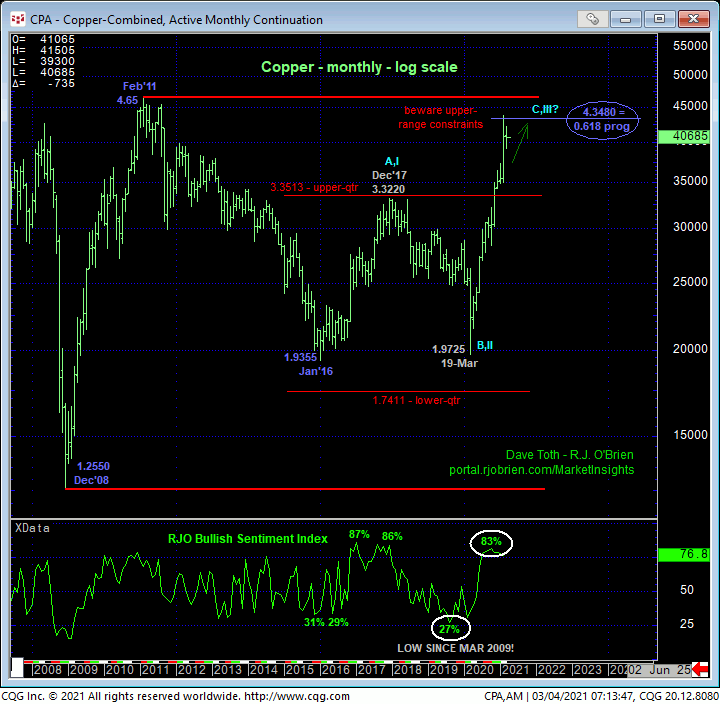
The market’s break overnight below Tue’s 4.0415 initial counter-trend low reaffirms our peak/correction/reversal count introduced in Tue’s Technical Blog and leaves Tue’s 4.2275 high in its wake as the latest smaller-degree corrective high it’s now required to recover above to render the sell-off attempt from 25-Feb’s 4.3755 high another 3-wave and thus corrective affair that would then be expected to re-expose the secular bull. In this regard, this 4.2275 level becomes our new short-term risk parameter from which non-bullish decisions like long-covers and cautious bearish punts can be objectively rebased and managed. Needless to say, a relapse below today’s 3.9300 low will reinforce this peak/correction/reversal count and expose potentially sharp losses thereafter.
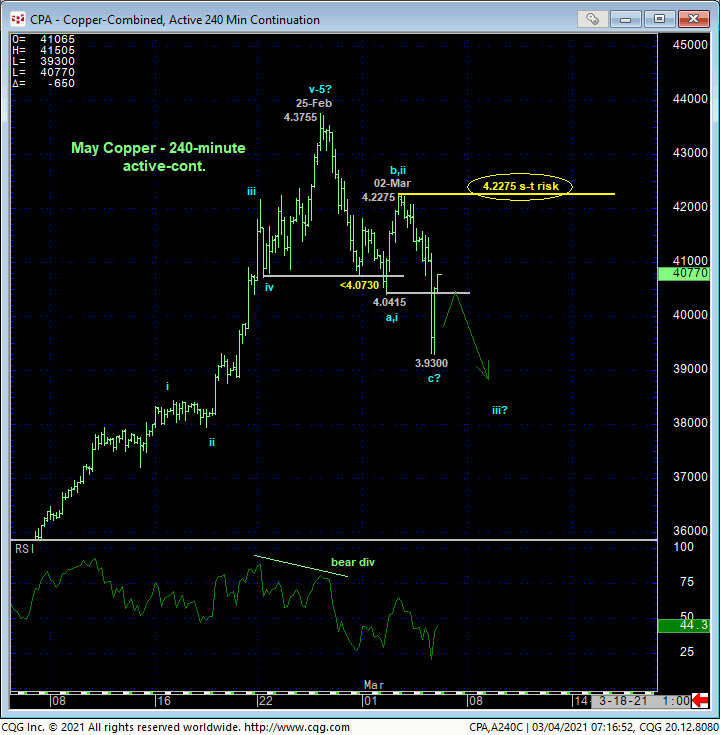
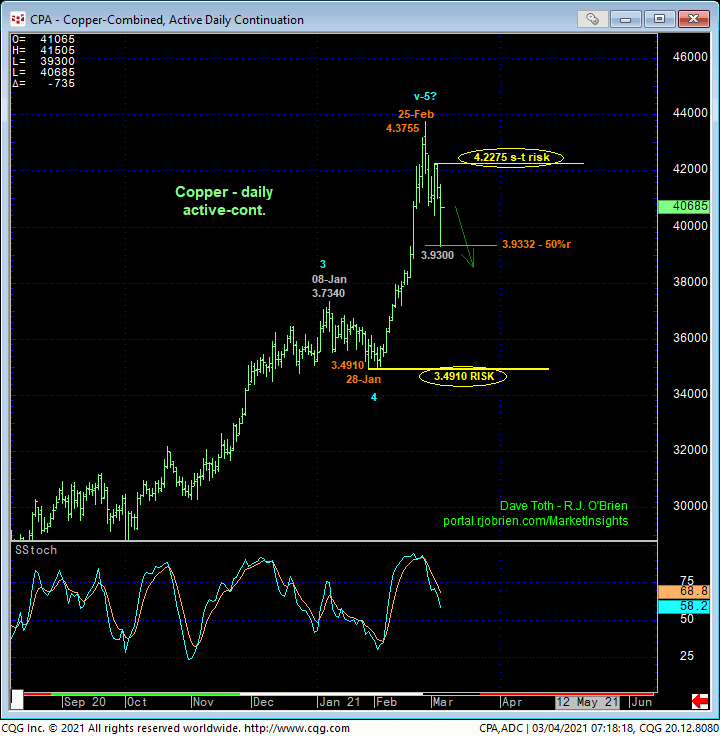
From a long-term standpoint, the magnitude of the secular bull trend requires commensurately larger-degree weakness below at least 28-Jan’s 3.4910 next larger-degree corrective low needed to, in fact, break the trend. With the possible development of today’s 3.9300 low and pretty much exact 50% retrace of Jan-Feb’s 3.4910 – 4.3755-portion of the bull, there are NO levels of any technical merit between spot and at least former 3.73-handle-area resistance from early-Jan. This is due to the extent and uninterrupted nature of Feb’s steep continuation of the bull. And merely “derived” levels like trend lines, Bollinger Bands, imokus and the ever-useless moving averages are of absolutely no use in identifying reliable support levels without an accompanying confirmed bullish divergence in momentum.
As recently discussed then, even for longer-term commercial players, risking an entire bullish position to 3.4910 is rather impractical. Per such, we’ve advised paring bullish exposure on the admittedly short-term mo failure and exchange whipsaw risk back above (now) 4.2275 for deeper nominal risk below 3.4910. And as a result of today’s bounce, more bullish paring can be done objectively on resumed weakness below today’s 3.9300 low.
Today’s reaffirmation of at least short-to-intermediate-term weakness is also important because it renders sentiment/contrary opinion an applicable technical tool. And it’s easy to see the historically frothy levels both our sentiment indicators have reached that are very typical of major peak/reversal-threat environments. The prospect that Jan-Feb’s portion of the rally might be the completing wave to a massive 5-wave sequence up from Mar’20’s 1.9725 low is also clear and contributes to this peak/reversal threat.
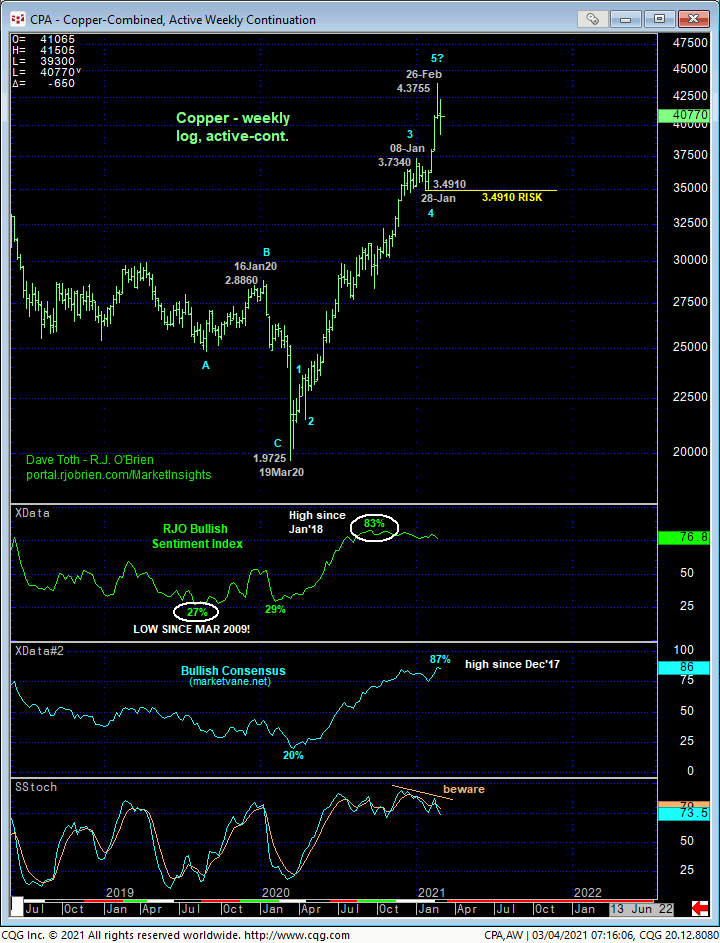
Finally and from an even longer-term perspective shown in the monthly log chart below, it is absolutely imperative for the market to resurrect and sustain trendy, impulsive behavior higher in order to maintain the risk/reward merits of a bullish policy “way up here” at the extreme upper recesses of its all-time historical range. If there’s a time and place to be leery of a peak/reversal threat that could be major in scope, it is here and now. The Fibonacci fact that the entire 5-year rally from Jan’16’s 1.9355 low is virtually 61.8% of the span (i.e. 0.618 progression) of 2008 – 2011’s preceding 1.2550 – 4.65 rally is an interesting adjunct to the peak/reversal-threat factors discussed above.
These issues considered, traders have been advised to move to a neutral-to-cautiously-bearish policy with a recovery above 4.2275 now minimally required to threaten this call and re-expose the secular bull. In lieu of such strength, further and possibly accelerated losses should not surprise with a relapse below 3.9300 reinforcing this count. Longer-term commercial players holding on to bullish exposure would be advised to pare or neutralize remaining exposure on a failure below 3.9300. The only remaining objective bull risk below 3.9300 is 3.4910.
