Given the recent swiftness with which the corn market has reached even loftier heights and where even a relatively minor but nominally steep hiccup has raised eyebrows about the prospects of a top, we thought it timely to do a little technical refresher on how this (or any) market typically tops out. Before getting started however, all must acknowledge current 6.50-area prices in Jul corn that are TWICE the levels of the past few years and where a 10-cent move back in 2017, 2018 or 2019 is the equivalent of a 20-cent move now in percentage terms. This is why much of our longer-term analysis includes logarithmic charts that measure percentage moves rather than typical nominal charts that measure arithmetic moves. So we can’t freak out “up here” when we see overnight swings from 6.84 to 6.29 like the past couple days.
We often talk about our three reversal requirements needed to, in this case, navigate from a bullish policy to a bearish one. These requirements include:
- a confirmed bearish divergence in momentum of a scale sufficient to, in fact, break the clear and present uptrend
- proof of trendy, impulsive price action down in that prospective initial counter-trend break, and, most importantly,
- proof of 3-wave, corrective behavior on a subsequent rebuttal to that initial break.
As we’ll show below, the current market has come nowhere close to satisfying ANY of these requirements, suggesting that yesterday/today’s hiccup is nothing more than another interim correction within the ongoing major bull trend. Indeed, trends, especially one as massive and steep as the current one in corn, typically slow down before they reverse. This slowdown process is characterized by some consolidative behavior- Elliott geeks call this a 4th-wave, Dow theorists might call in a left-shoulder, etc.; regardless of what technical theory you’re using, it’s all the same stuff, just different vernacular- followed by a (5th-wave or head) resumption of the trend that it then ultimately fails to sustain. And we gauge/navigate this failure precisely around the low boundary of that prior consolidation.
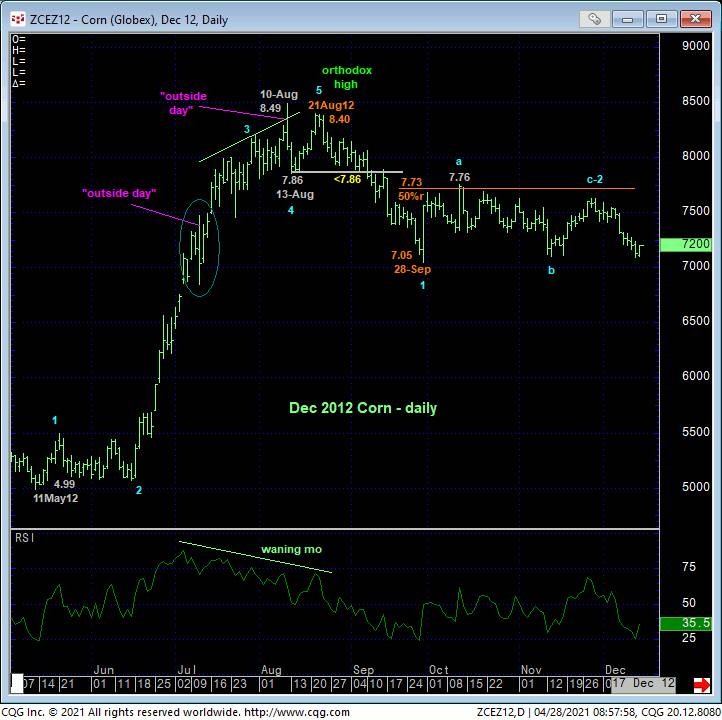
In the most epic of all corn peaks and reversals, the daily chart below is that of Dec2012 corn when it made its major top in Aug 2012. In recent technical blogs and webcasts, we’ve made it a point to identify the past few weeks’ steep, accelerated portion of the bull as a 3rd-wave, characterizing the strongest component of a move that requires a (4th-wave) consolidation/slowdown stint ahead of at least another (5th-wave) round of new highs. Revisiting that infamous 2012 period, the market provided precisely the same type of steep, accelerated behavior from mid-Jun until mid-to-late-Jul when the RATE of ascent slowed, creating the POTENTIAL for a bearish divergence in momentum.
The market posted a somewhat-spastic intra-day high of 8.49 on Aug 10 ahead of what we believe is the orthodox end to that secular bull on 21Aug12 at 8.40. It wasn’t until 10Sep12 that the market CONFIRMED the bearish divergence in momentum on a scale sufficient to threaten the secular bull by failing below 13-Aug’s 7.86 corrective low. That mo failure satisfied only the first of our three reversal requirements. Continued trendy, 5-wave impulsive weakness to 28-Sep’s 7.05 low satisfied the second reversal requirement. Thereafter, the market spent the next TWO MONTHS laboring in a 3-wave corrective recovery that satisfied our third reversal requirement before yielding to the major reversal lower. And even then, it wasn’t until Apr 2013 when the bear really kicked in and didn’t look back.
The point here is that it’s very likely to take considerable and commensurately larger-degree topping behavior to reverse all the forces of one of this market’s greatest bull moves. It is NOT going to top out overnight with assertions of a “key reversal” (higher high, lower low and lower close than the previous day’s range and close). So-called “key reversals” are misnamed as they’re minor in nature with NO impact on a major trend. In that infamous 2012 rally we’ve circled such an ‘outside day” on 11Jul12, a “key reversal” that last a few hours. There was another “key reversal” on 10-Aug that, in hindsight, was arguably a component of a broader peak/reversal process, but again, that top/reversal didn’t have any teeth until 10-Sep’s confirmed mo failure below 7.87.
Understanding these components of a topping process, let’s apply them to current Jul and Dec contracts.
JUL CORN
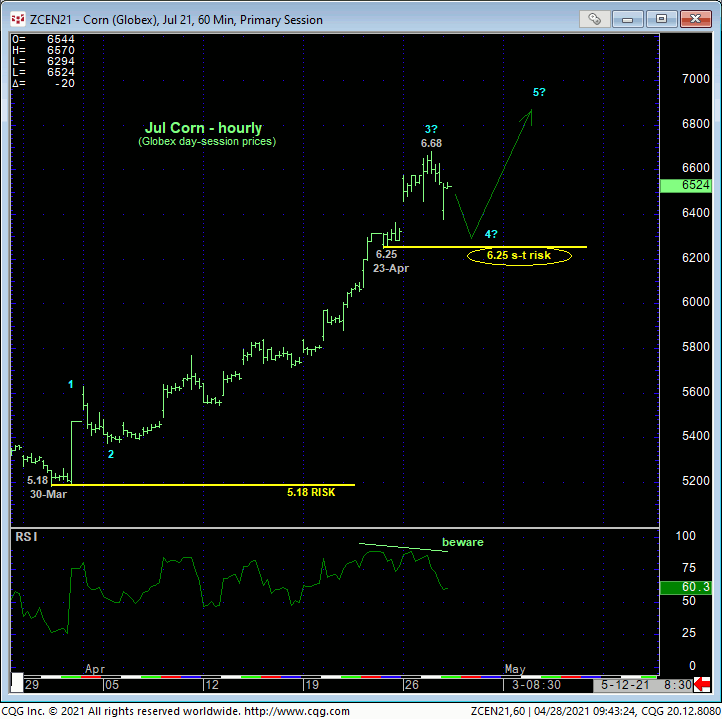
In yesterday’s Technical Webcast, we identified Fri’s 6.25 low as the latest smaller-degree corrective low and minimum level this market needs to fail below to confirm a bearish divergence in short-term momentum needed to break even the portion of the secular bull from 30-Mar’s 5.18 next larger-degree corrective low and key long-term risk parameter. But it’s a given that even on a sub-6.25 failure, this momentum divergence would be of too minor a SCALE to conclude anything more than another interim corrective hiccup. We could hardly conclude a major top from such piddly weakness. But such a smaller-degree mo failure below 6.25 WOULD be sufficient for shorter-term traders with tighter risk profiles to pare or neutralize bullish exposure to circumvent the depths unknown of the suspected correction. Such a minor mo failure would also have the benefit of defining a more reliable high from which shorter-term non-bullish decisions like long-covers and cautious bearish punts can be objectively based and managed.
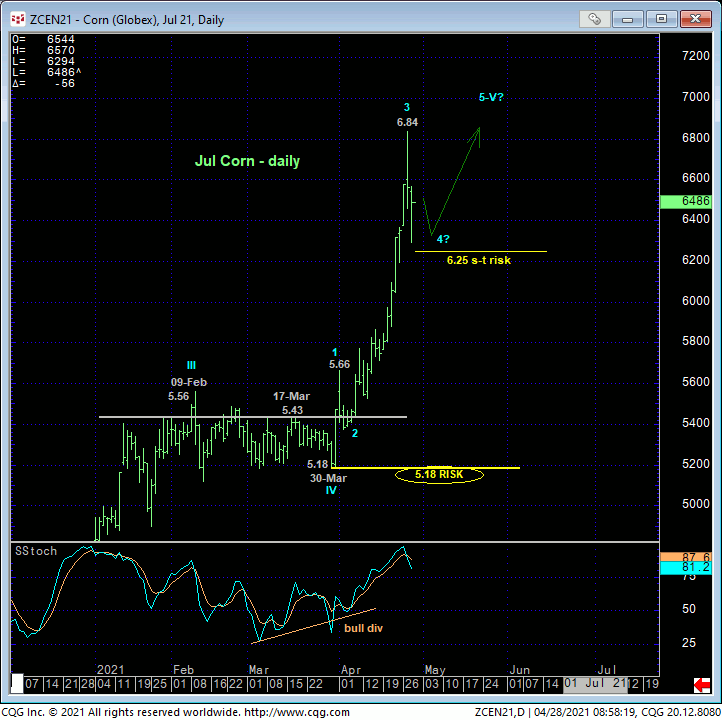
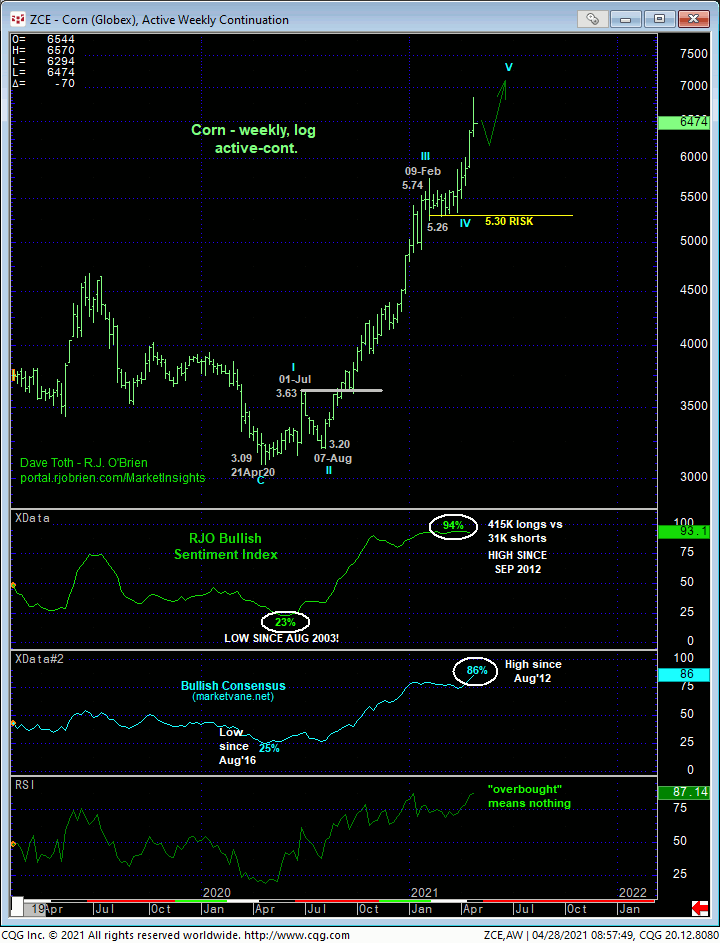
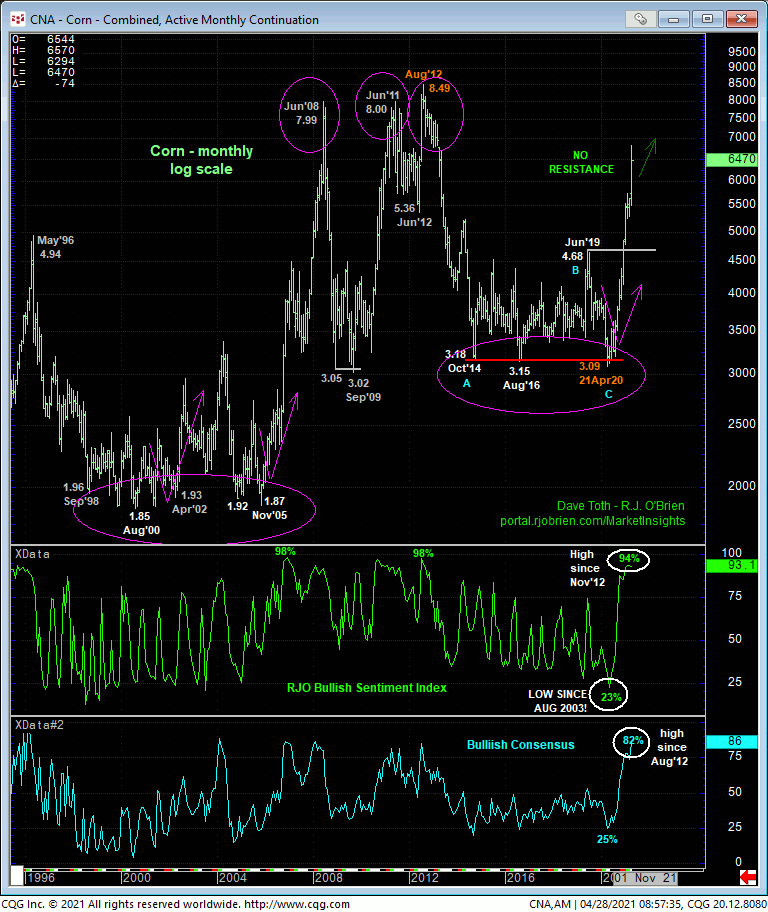
On a broader scale, 30-Mar’s 5.18 low in the now-prompt Jul contract equates to that day’s 5.30 low in the then-prompt May contract as the level this market needs to fail below to, in fact, break the secular bull trend shown in the weekly log chart above and monthly log chart below. What the market might have in store for us between 6.25 and even former 5.50-area resistance-turned-support, let alone 5.30 or 5.18 is anyone’s guess and why the technical and trading issue of SCALE is so important. A failure below 6.25 is pertinent to shorter-term traders to take defensive steps. Such sub-6.25 weakness would be grossly insufficient and premature for longer-term commercial players to give up on the secular bull and move to a bearish policy (unless they were willing to acknowledge and accept whipsaw risk above whatever high is left in the wake of such a mo failure in exchange for deeper nominal risk to 5.30 or 5.18.
These issues considered, a full and aggressive bullish policy and exposure remain advised with a failure below 6.25 required for shorter-term traders to move to the sidelines in order to circumvent the depths unknown of a likely slightly larger-degree correction within the still-unfolding secular bull trend. In lieu of at least such sub-6.25 weakness, further and possibly accelerated gains remain expected to levels indeterminately higher, including a run at 2012’s all-time high. A bullish policy remains advised for long-term commercial players with a failure below at least 5.50 and preferably 5.18 required to break the secular bull trend and warrant neutralizing all long exposure.
DEC CORN
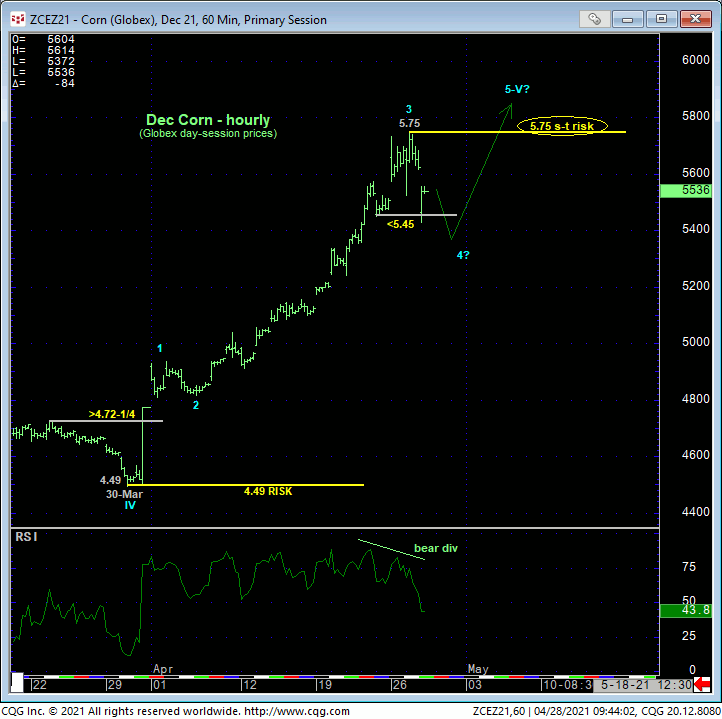
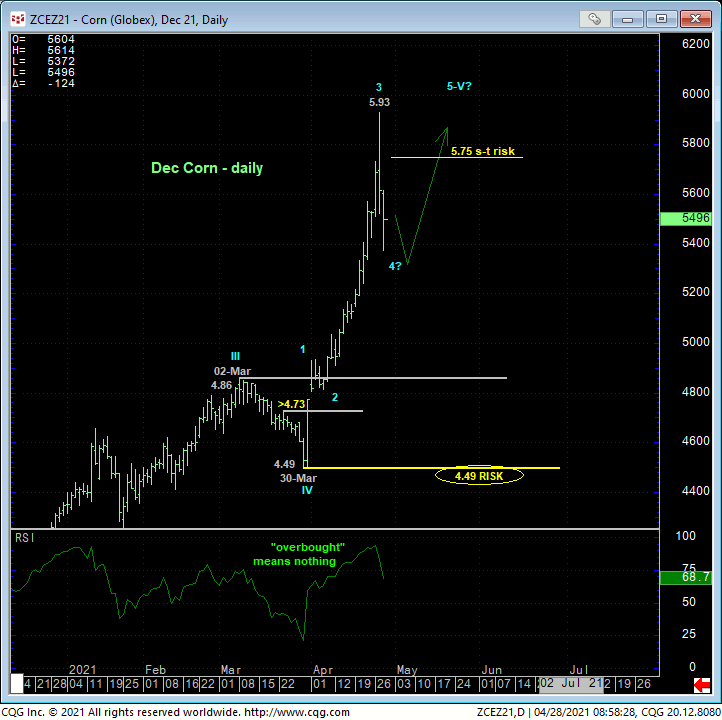
Per the same metrics as above, this morning’s slip below Fri’s 5.45 corrective low in the Dec contract DID confirm a bearish divergence in short-term momentum, defining yesterday’s 5.75 Globex day-session high as one of developing importance and our new short-term risk parameter from which non-bullish decisions like long-covers and cautious bearish punts can be objectively based and managed. Obviously, if the market has something bigger in store to the downside after such a piddly-small momentum failure, it should not be able to recover above 5.75. Such a 5.75+ recovery would render the sell-off attempt from 5.75 a 3-wave and thus corrective affair, reinstate the bull and expose potentially steep gains thereafter.
Only a glance at the daily chart of the Dec contract below is needed to see that a failure below 30-Mar’s 4.49 next larger-degree corrective low and key risk parameter remains required to, in fact, break the secular bull trend. Given the large amount of green between 5.75 and 4.49, the technical and trading matter of SCALE is obviously important.
These issues considered, a bullish policy and exposure remain advised for long-term players with a failure below at least former 4.85-area resistance-turned-support from Mar required to threaten this bullish policy. Shorter-term traders have been advised to neutralize bullish exposure on today’s failure below 5.45. This circumvents the depths unknown of a suspected correction lower and identifies yesterday’s 5.75 high as the level the market now needs to recoup to render yesterday/today’s setback another corrective affair within the resumed secular bull trend.
