JUL CORN
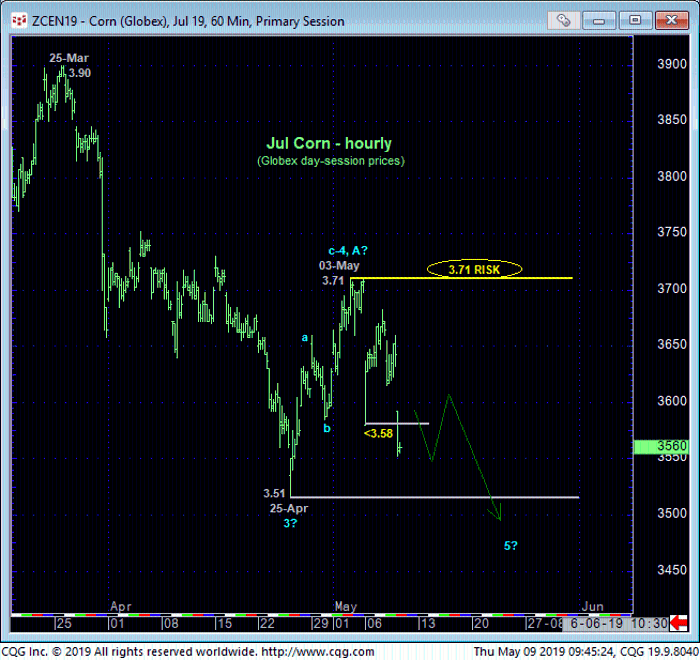
Today’s relapse below Mon’s 3.58 low renders the recent pop from 25-Apr’s 3.51 low to last Fri’s 3.71 high a 3-wave affair as labeled in the hourly chart below. Left unaltered by a recovery above 3.71, this 3-wave recovery attempt is considered a corrective/consolidative structure that warns of a resumption of this year’s major, if intra-range downtrend that preceded it. Per such we are identifying that 3.71 high as our new key long-term risk parameter from which both short- and long-term, traders are now advised to rebase and manage the risk of either a continued or resumed bearish policy and exposure.
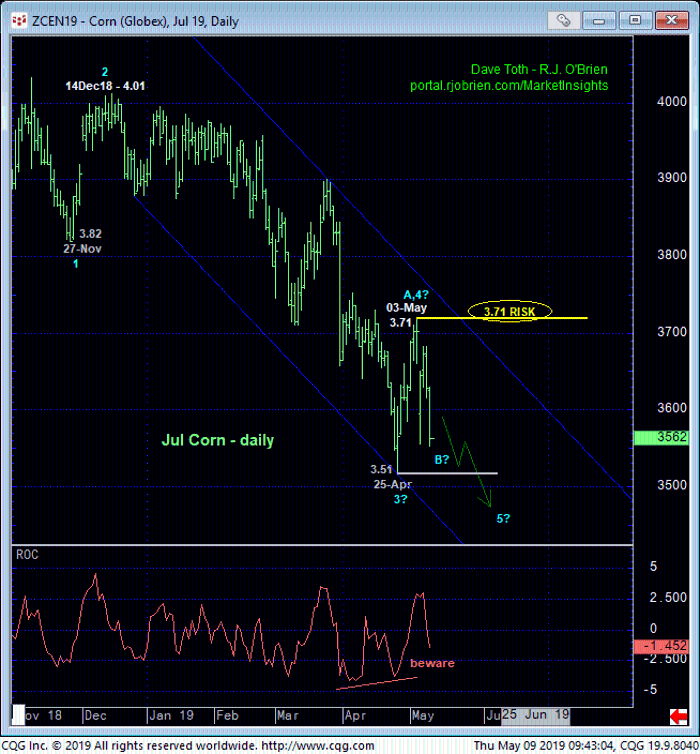
Especially as a result of this week’s relapse, it’s not hard to consider the recent recovery attempt as merely corrective against the backdrop of the major downtrend on a daily basis above. Should the market recover above 3.71 however, such a bullish divergence in momentum combined with historically bearish sentiment conditions would expose a base/reversal count that could be major in scope. In lieu of such 3.71+ strength we anticipate an eventual break below 25-Apr’s 3.51 low that could produce accelerated losses thereafter.
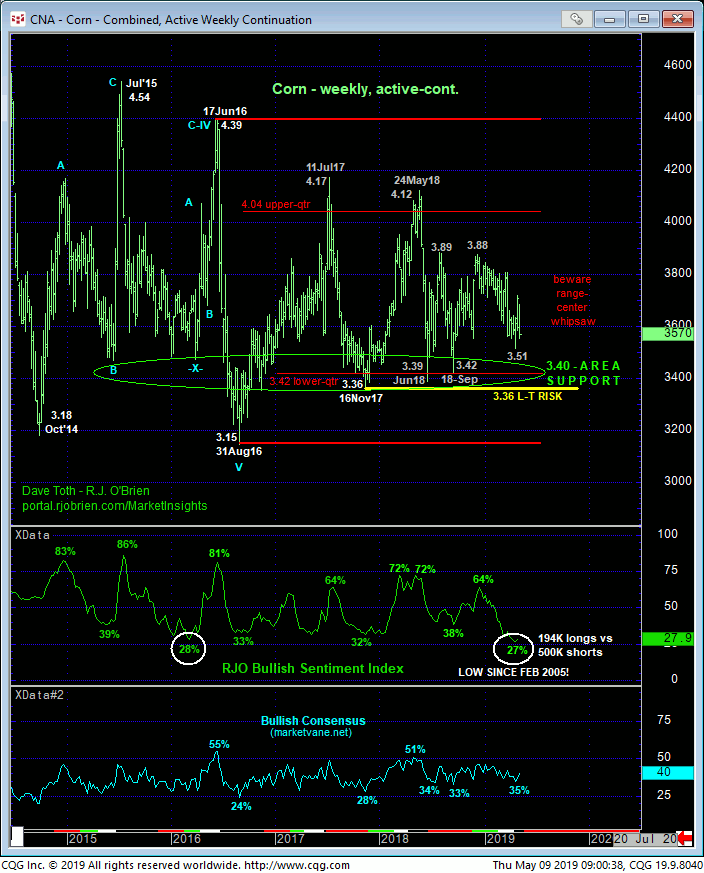
Such recent corrective highs and risk parameters like 3.71 are CRITICAL to managing bear risk “down here” as the market engages the (3.40-area) lower-quarter of the massive 4-1/2-YEAR lateral range that has repelled all previous attacks. This is especially the case now with our RJO Bullish Sentiment Index of the hot Managed Money positions reportable to the CFTC wafting around at levels not seen since 2005! At a current 28% reading reflecting a whopping 500K shorts to just 194K longs, it’s not hard to find fuel for upside vulnerability. But traders are reminded that sentiment/contrary opinion is not an applicable technical tool in the absence of a confirmed bullish divergence in momentum of a scale sufficient to threaten or break the broader downtrend. Herein lies the importance of last week’s 3.71 high and key risk parameter.
These issues considered, a bearish policy remains advised for long-term players with a recovery above 3.71 negating this specific all and warranting its immediate cover. Shorter-term traders whipsawed out of bearish exposure following 01-May’s bullish divergence in short-term momentum are advised to first approach rebound attempts to the 3.62 level OB as corrective selling opportunities with a recovery above 3.71 required to negate this call and warrant its cover. In lieu of such 3.71+ strength we anticipate an eventual break below 25-Apr’s 3.51 low exposing a run at that pivotal 3.40-area support or below.
DEC CORN
The technical construct and expectations for the Dec contract are identical to those detailed above for the Jul contract with last Fri’s 3.88 corrective high considered our key long-term risk parameter this market is required to recoup to negate this bearish count and warrant its cover. The levels noted in the daily chart of new crop corn below are also pertinent to our two bearish option strategies below that utilize the CME’s very useful short-dated Jun and Jul options on the Dec contract.

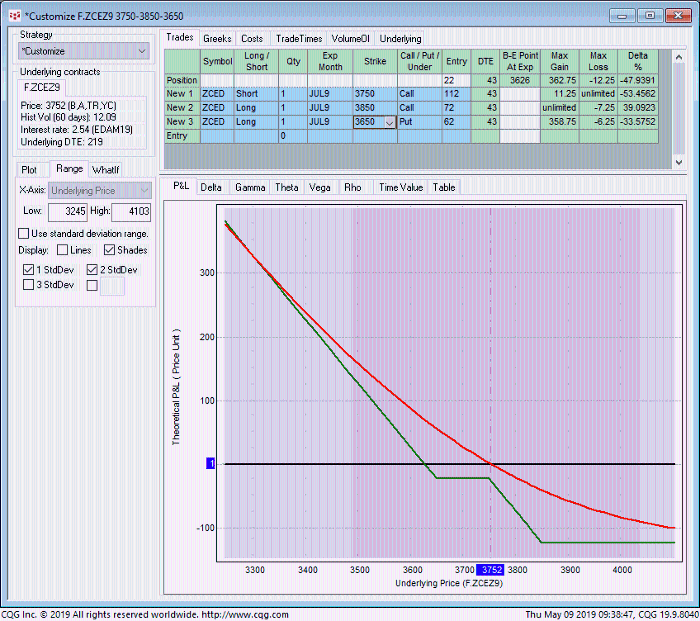
PRODUCER BEAR HEDGE: SHORT JUL SHORT-DATED 3.75 – 3.85 CALL SPREAD / LONG JUL SHORT-DATED 3.65 PUT “COMBO”
This combo strategy is structured acknowledging recent 3.88-area resistance in the Dec contract by selling the Jun Short-Dated 3.75 – 3.86 Call Spread for around 4-cents and buying the Jul Short-Dated 3.65 Puts around 6-1/4-cents for a net cost of about 2-1/4-cents. This strategy provides:
- a current net delta of -0.48
- favorable margins
- maximum risk/cost of 12-1/4-cents on ANY rally above 3.85 that will allow cash position to continue to profit
-
- (although this loss/risk should be less if this hedge is covered if/when the market recoups our 3.88 bear risk parameter in the Dec contract)
- unlimited dollar-for-dollar downside hedge protection below its 3.62-3/4 breakeven point at expiration.
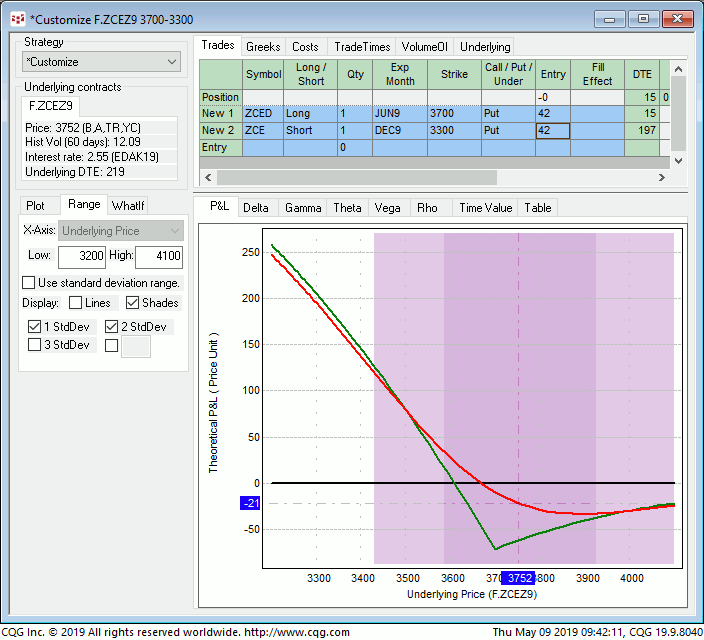
BEAR SPEC: JUN SHORT-DATED JUN 3.70 / DEC 3.30 PUT DIAGONAL
As initiating bearish exposure “down here” may be harrowing, doing so via the Jun Short-Dated 3.70 / Dec 3.30 Put Diagonal provides negligible risk if the market reverses higher. This strategy involves buying 1-unit of the Jun Short-Dated 3.70 Puts around 4-1/4-cents and selling the Dec 3.30 Puts around 4-1/4-cents for a net cost of “even”. This strategy provides:
- a current net delta of -0.20
- a whopping 5:1 gamma ratio
- negligible risk of a sharp rally in the underlying Dec contract
- profit potential, of up to 40-cents on a sustained move below 3.60.
As always with long-gamma strategies, this gamma advantage comes in exchange for theta, or time-decay risk, where aimless, lateral chop hurts this position. If tomorrow’s key crop report proves to be an absolute dud and the market flatlines for a week, this strategy runs the risk of the long closer-to-the-money and closer-to-expiration Jun Short-Date put expiring worthless. This would leave a naked short position in the Dec 3.30 put that would then pose unlimited risk. Butt with a full two weeks before the Jun Short-Dated option’s expiration on 24-May, we have plenty of time for the market to show its directional hand. If the market doesn’t move substantial by early-to-mid next week, this entire strategy should be covered for what should be a very small loss.
Please contact your RJO representative for updated bid/offer quotes on these strategies.
