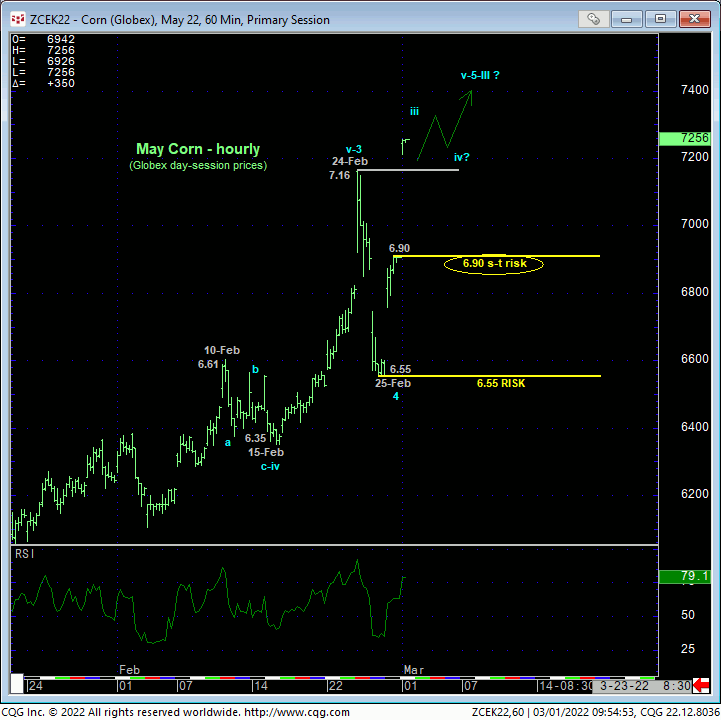
Today’s break above last week’s 7.16 high reaffirms the secular bull trend and identifies Fri’s 6.55 low as the latest larger-degree corrective high this market is now minimally required to fail below to confirm a bearish divergence in momentum on a scale sufficient to threaten the massive bull. On a shorter-term basis however, since the resumed bull from 6.55 has been a straight shot that has produced no smaller-degree corrective lows, we can only considered lock-limit-bid high at 6.90 as an area of former resistance-turned-support and level the market would fully be expected to sustain gains above per any broader bullish count. Per such and for the time being, we’re defining that 6.90 level as pour new short-term bull risk parameter from which shorter-term traders can rebase and manage the risk of a still-advised bullish policy and exposure.
What we suspect will happen, even on a shorter-term basis and as always, is that this latest portion of the bull trend from Fri’s 6.55 low needs to slow down before it can reverse. This slowdown event that precedes virtually all ultimate peaks typically takes the form of a smaller-degree (4th-wave) corrective/consolidative event, a (5th-wave) resumption of the bull and the market’s eventual failure to sustain those last-gasp gains below the low of the preceding correction. We’ve seen NO such behavior on a shorter-term basis for the resumed bull from 6.55. Per this definition of a slowdown process and confirmed divergence, Fri’s 6.55 low serves as precisely such a level on a longer-term basis.


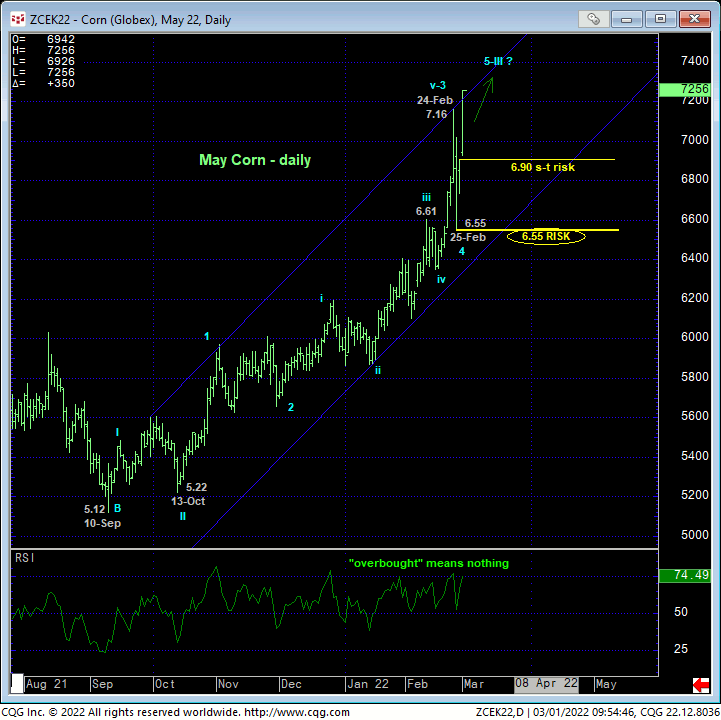
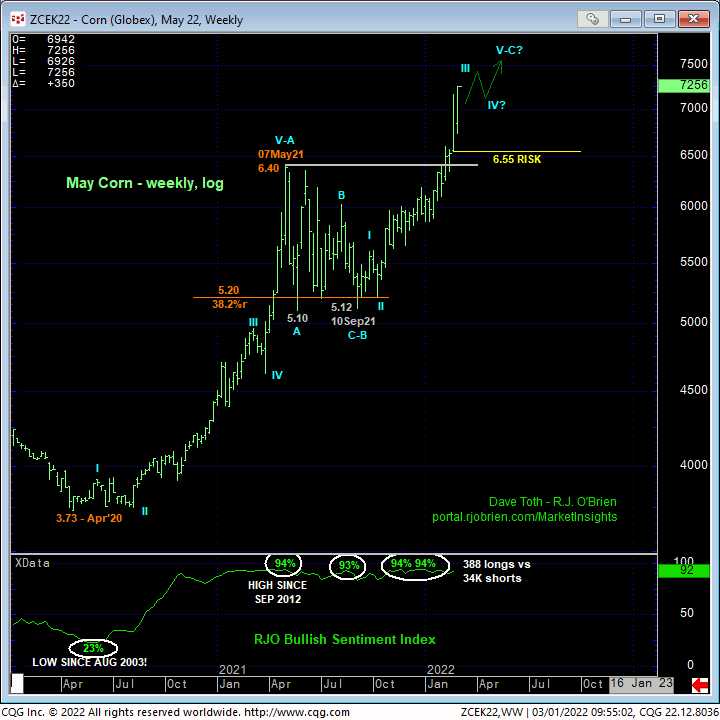
Stepping back to the next larger scale, what’s notable about the past couple months’ portion of the bull is that it has been ACCELERATING. On both a daily basis above and weekly log scale basis below, the rally from 13-Oct’s 5.22 low is arguably a massive 3rd-Wave “extension” that has yet to end WITHIN an even broader and eventual 5-wave sequence from last Sep’s 5.12 low. If correct, this count calls for at least one “decent” round of (4th-Wave) consolidation that may span a few weeks or a month before a final and completing 5th-Wave continuation of the bull that could easily challenge 2012’s 8.49 all-time high or break it. To threaten such a major bullish count, all the market’s got to do is fail below 6.55. Until such commensurately larger-degree weakness is proven, traders are urged not to underestimate this market’s remaining upside potential.

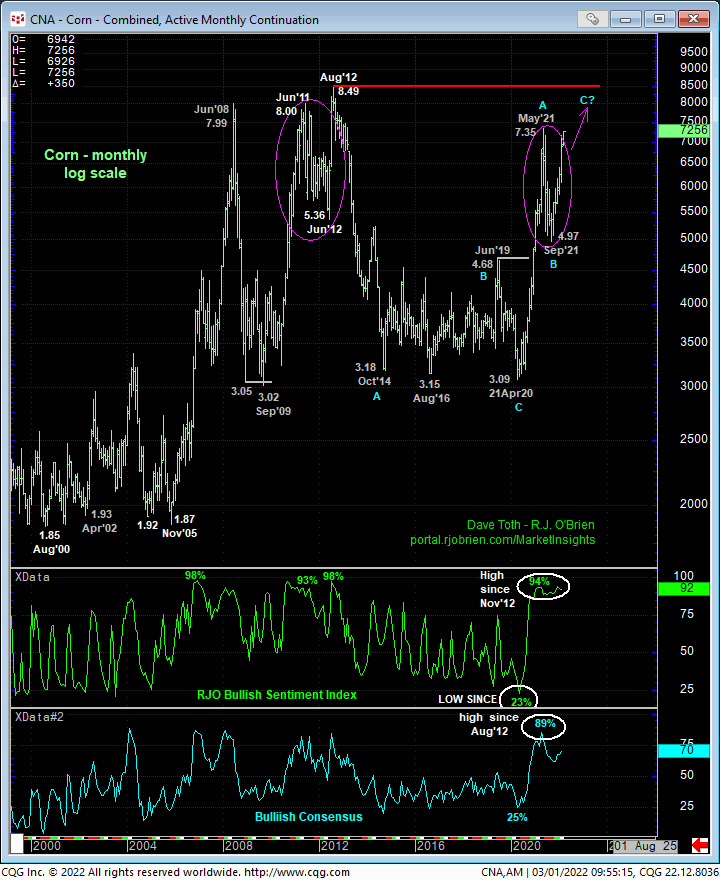
On an even broader monthly log scale active-continuation basis, the chart below shows that as a result of the extent and impulsiveness of the rally from Sep’s 4.97 low, we believe it is likely that Sep’s 4.97 low completed the correction of Apr’20 – May’21’s 3.09 – 7.35 rally and now exposes the resumption of that uptrend that preceded it to new highs above last summer’s 7.35 high. Given the extent of this week’s rally, such 7.35+ gains now seem like a foregone conclusion. What’s important to acknowledge however is that there are NO levels of any technical merit above 7.35 shy of 2012’s 8.49 high. This doesn’t mean we’re forecasting a move to 8.49. But it certainly dos mean that until and unless the market stems the clear and present and major bull trend with a confirmed bearish divergence in momentum, it’s upside potential is indeterminable and potentially extreme, including a run at and perhaps through 8.49.
These issues considered, a full and aggressive bullish policy and exposure remain advised with a failure below at least 6.90 and preferably 6.55 required to defer and threaten this call and warrant paring or neutralizing exposure. We will be watchful for the developing potential for a bearish divergence in short-term mo and update traders accordingly. In lieu of such a development or a failure below at least 6.90, further and possibly accelerated gains remain expected.


