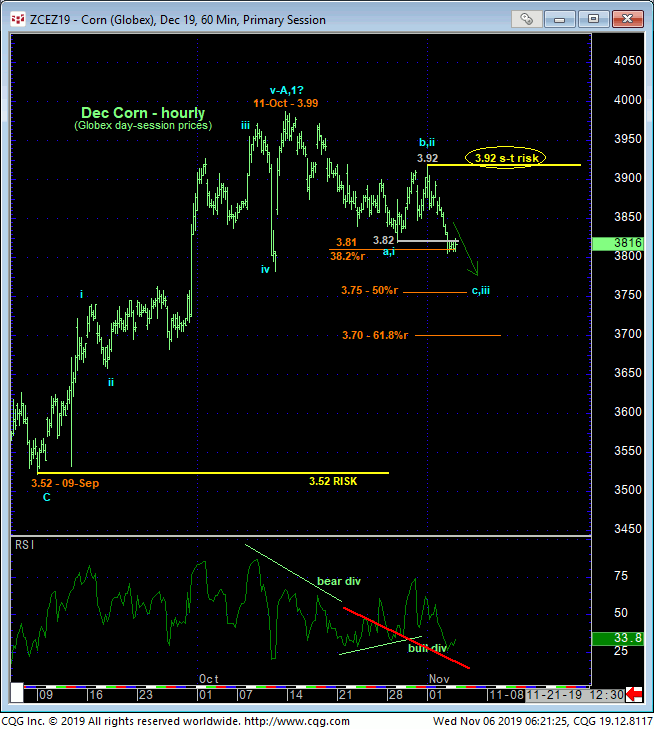
Yesterday’s relapse below 29-Oct’s 3.82 low and our short-term risk parameter nullifies the bullish divergence in short-term momentum discussed in 30-Oct’s Technical Blog and resurrects the decline from 11-Oct’s 3.99 high that we still believe is merely a correction of Sep-Oct’s rally within a much broader base/reversal environment. This resumed slide leaves 01-Nov’s 3.92 high in its wake as the latest smaller-degree corrective high the market is now required to sustain losses below to maintain a more immediate bearish count. In this regard this 3.92 level becomes our new short-term risk parameter from which shorter-term traders with tighter risk profiles can objectively base non-bullish decisions like long-covers and cautious bearish punts.

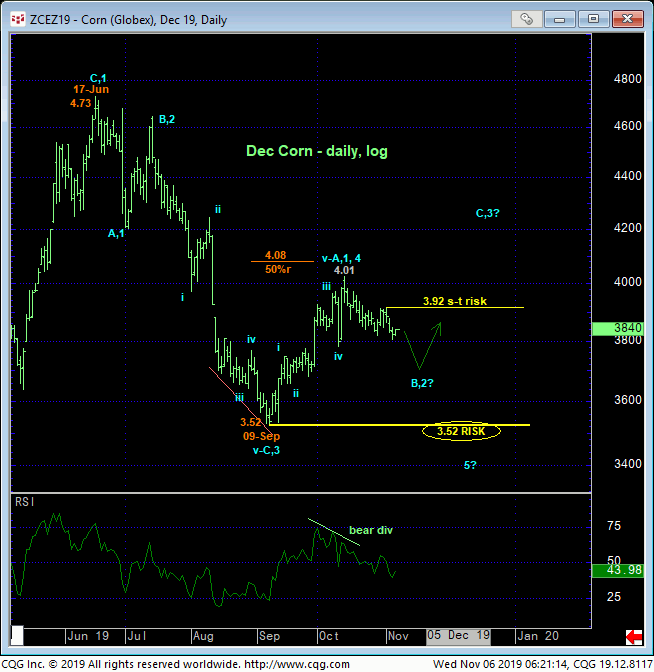
From a longer-term perspective and especially given the 5-wave impulsiveness of Sep-Oct’s 3.52 – 4.01 rally as labeled in the daily log chart below, commensurately larger-degree weakness below that 3.52 low remains required to negate our long-term base/reversal count that contends that 3.52 – 4.01 rally is just the INITIAL (A- or 1st-Wave) rally of a major base/correction/reversal environment and that this current slide is just a (B- r 2nd-Wave) corrective buying opportunity for longer-term players. We’ve noted the derived 38.2%, 50% and 61.8% retraces of Sep-Oct’s rally in the hourly chart below as reference points around which to be watchful for a relapse-stemming bullish divergence in momentum needed to reject/define a more reliable low and support level from which bullish bets can only then be objectively based and managed.
Remember, merely “derived” technical levels like Bollinger Bands, imokus, trend lines, the ever-useless moving averages and even the vaunted Fibonacci relationships we cite often in our analysis NEVER have proven to be reliable reasons to define/expect support (or resistance) without an accompanying bullish (in this case) divergence in momentum needed to, in fact, break the downtrend. Until such a mo failure stems the current intermediate-term downtrend, there’s no way whatsoever to judge its depth OR the alternate bearish prospect that our entire base/reversal count is just flat-out wrong ahead of a resumption of the secular bear market to sub-3.00. By contrast, we know with specificity that a recovery above a corrective high like 3.92 mitigates any bearish count and reinforces a bullish one.


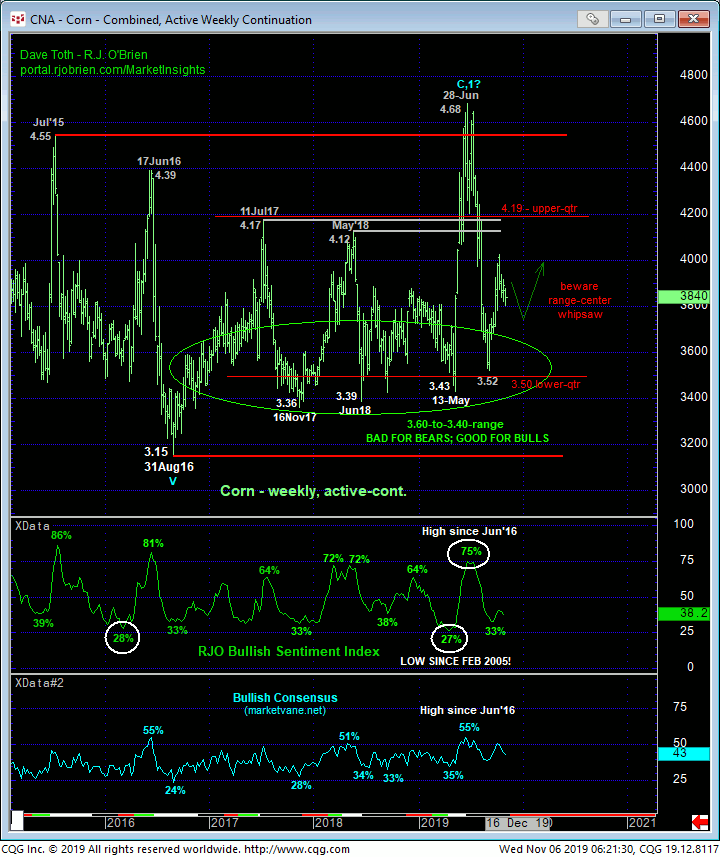
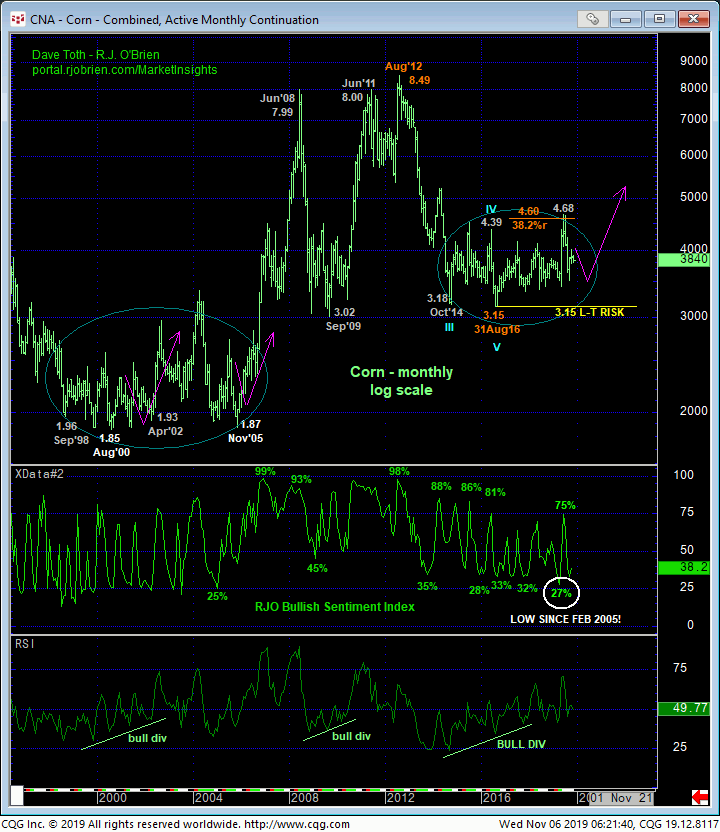
The weekly chart below shows the market’s position deep within the middle-half bowels of a range that arguably dates back the past five years. As discussed many, many times over the past three years, this 5-year price action is virtually identical to that that followed Sep 1998’s 1.96 low and the start of a major, multi-year base/reversal environment. This fact, along with historically bearish sentiment generated by the huddled masses each and every time this market slips to the lower-quarter of this range around the 3.60-to-3.40-range, form the basis of our long-term base/reversal count. Until threatened by a relapse below at least Nov’17’s 3.36 low, we believe corn will trade at indeterminably higher levels above 4.80.
The question/challenge is identifying which crop year the next secular bull will take hold. Just like in years 2003, 2004 and 2005 that extended that bottoming process out to SEVEN YEARS, this market could easily stay imprisoned between 4.50 and 3.40 for years to come. Understanding this however, we can formulate the same game plan we’ve espoused for the past three years: watching for bullish divergences in momentum from the lower-quarter of this range to establish favorable and opportunistic risk/reward bullish policy and bearish divergences in mo from the range’s upper-quarter to establish interim bearish policy. It’s the current range-center that causes the greatest directional risk/reward challenges due to aimless whipsaw risk typical of such range-center conditions. And noting a more conservative approach to risk assumption under such whipsaw circumstances, tighter but objective risk parameters like 3.82 last week and 3.92 currently are critical to effectively managing range-center directional risk.
These issues considered, a bullish policy remains advised for long-term players with a failure below 3.52 required to negate this cal and warrant its cover. Shorter-term traders with tighter risk profiles have been advised to neutralize bullish exposure and are further advised to move to a neutral-to-cautiously-bearish stance from 3.85 OB with a recovery above 3.92 negating this call, warranting its cover and resurrecting a bullish count. We will be watchful for a relapse-stemming bullish divergence in momentum from the 3.75-to-3.70-range that could present an excellent risk/reward buying opportunity.


