JUL CRUDE OIL
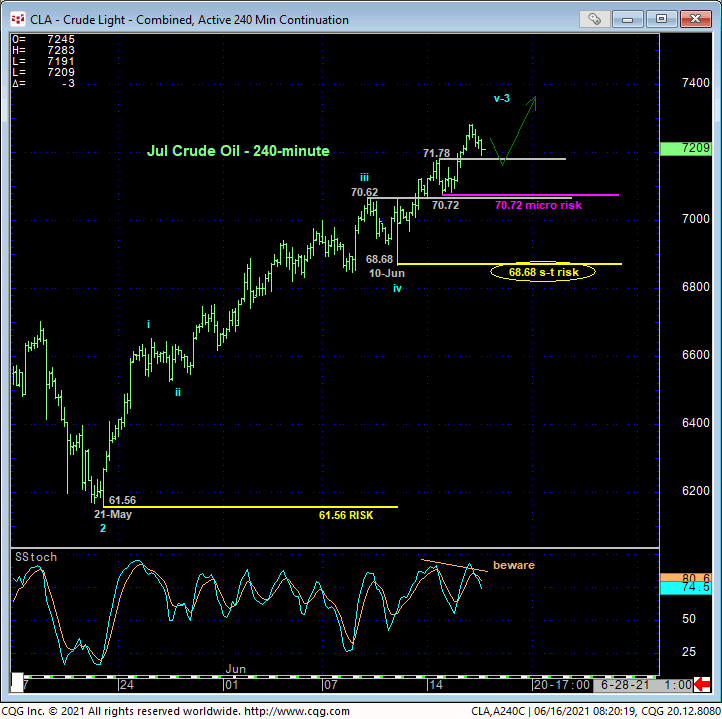
The 240-min chart below shows yesterday’s break above Mon’s 71.78 high reaffirms the secular bull trend from Apr’20’s 6.50 low and leaves smaller-degree corrective lows in its wake at 70.72 and 68.68 that the market would now be expected to sustain gains above to maintain a more immediate bullish count. Its failure to do so would confirm a bearish divergence in short-term momentum and threaten and then break the portion of the major bull from 21-May’s larger-degree corrective low at 61.56. Per such, 70.72 and 68.68 are considered our new micro- and short-term risk parameters from which shorter-term traders with tighter risk profiles can objectively rebase and manage the risk of a still-advised bullish policy and exposure.
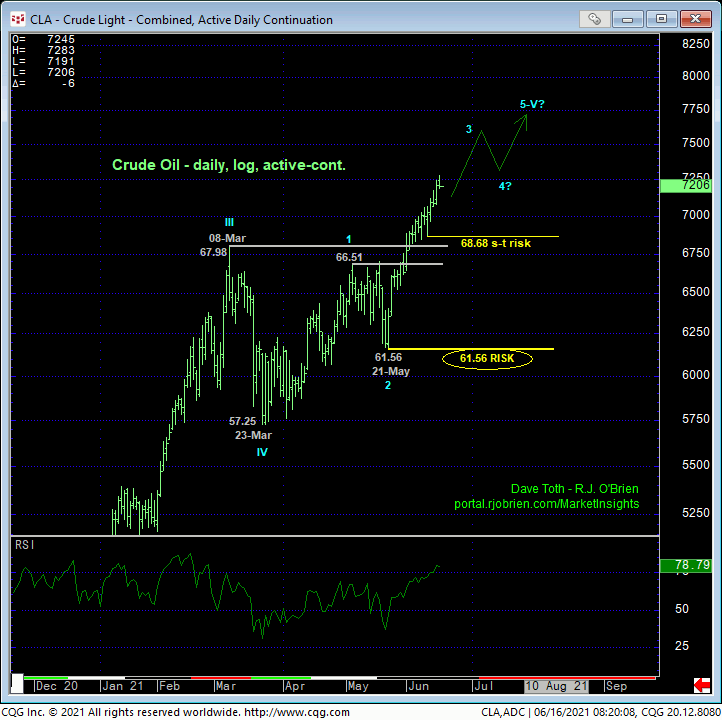
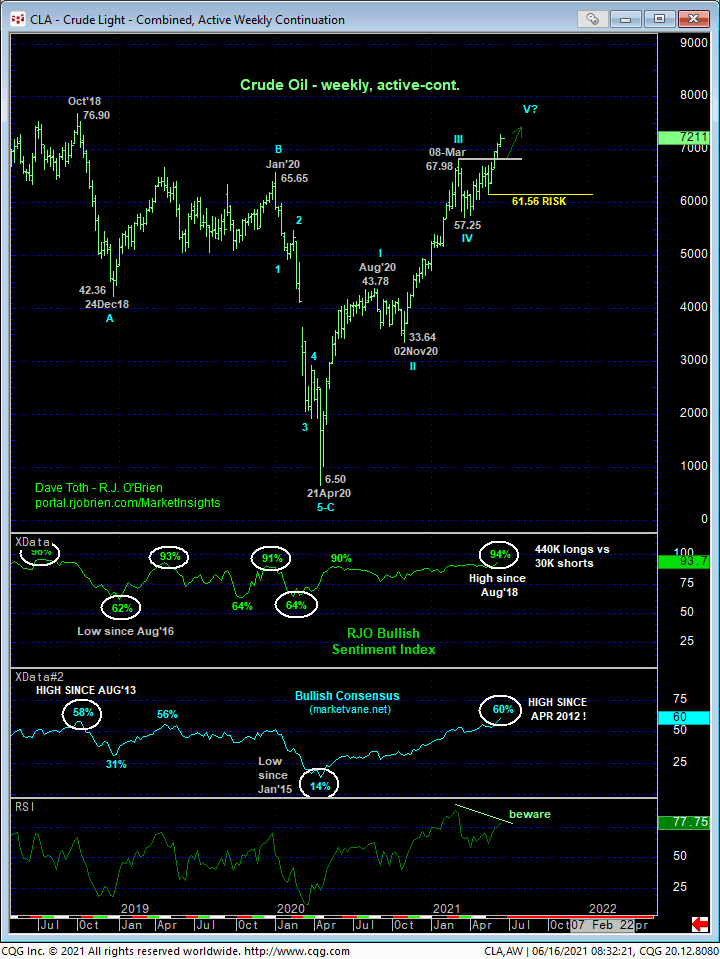
The daily (above) and weekly (below) charts show the dominance of the major bull trend with the market holding well above key former 68.00-to-66.50-area resistance from Mar-May that, since broken, serves as a key new support candidate. A short-term failure below 68.68 arguably breaks the uptrend from 21-May’s 61.56 larger-degree corrective low, but weakness below AT LEAST the 66.50-area is required to even threaten the secular bull, let alone break it. Indeed and on a major scale, a failure below 61.56 remains required to break the major 14-month uptrend.
This said, this major bull trend is not without threats like:
- waning upside momentum on a weekly basis below
- historically frothy bullish sentiment not seen since at least Aug’18 and, in the case of the Bullish Consensus (marketvane.net), since Apr 2012, and
- the prospect that the rally from 23-Mar’s 57.25 low is the completing 5th-Wave of a major Elliott sequence from Apr’20’s 6.50 low as labeled below.
However, NONE of these factors and observations matter worth a spit until and unless this market breaks the simple uptrend pattern of higher highs and higher lows. Herein lies the importance of the corrective lows and specific risk parameters identified above. And these may come in handy given not only the threats listed above, but also because of confirmed bearish divergences in short-term momentum in the heating oil and RBOB markets that have exposed at least corrective setbacks. These components of the energy complex are unlikely to trend in opposing directions for long, so something’s gotta give with one or the other.
These issues considered, a bullish policy and exposure remain advised with a minimum failure below 70.72 required for very short-term traders to step aside. Slightly larger-degree weakness below 68.68 is required for short-term traders to move to the sidelines and for even longer-term commercial players to pare exposure to more conservative levels. In lieu of such weakness, further and possibly accelerated gains remain expected.
JUL HEATING OIL
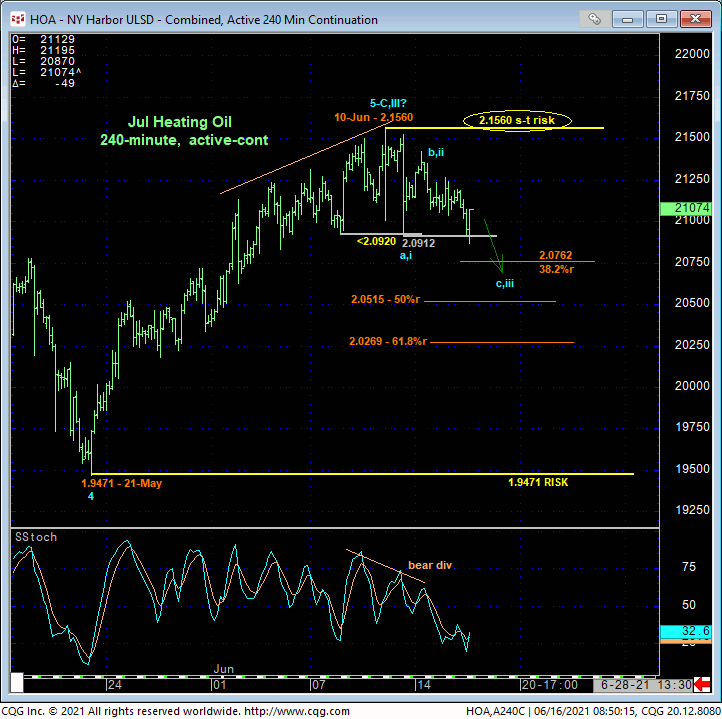
On the heels of 11-Jun’s bearish divergence in short-term momentum discussed in that day’s Technical Webcast, the 240-min chart above shows this week’s continued erosion that reinforces 10-Jun’s 2.1560 high as one of developing importance and our short-term risk parameter from which non-bullish decisions like long-covers can be objectively based and managed by shorter-term traders. Indeed, it is clear that 2.1560 is THE level this market now needs to recoup to render the sell-off attempt from last week’s high a 3-wave and thus corrective affair consistent with the still-unfolding secular bull trend.
Given the backdrop of the secular bull trend, the fact that the past week’s setback has thus far failed to retrace even a Fibonacci minimum 38.2% of May-Jun’s 1.9471 – 2.1560 rally and the fact that the crude oil bull remains intact as described above, traders of all risk profiles should not be surprised by a trendy, impulsive recovery above 2.1560 and resurrection of the major bull. The proof’s in the proverbial pudding however, so from a strict technical discipline this market remains required to recoup 2.1560 to nullify last Fri’s momentum divergence, confirm the setback as corrective and reinstate the secular bull.
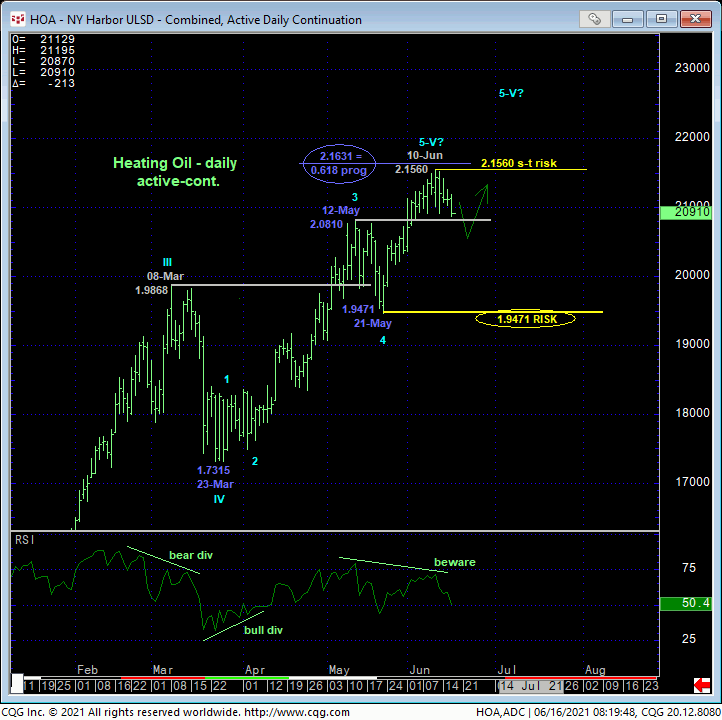
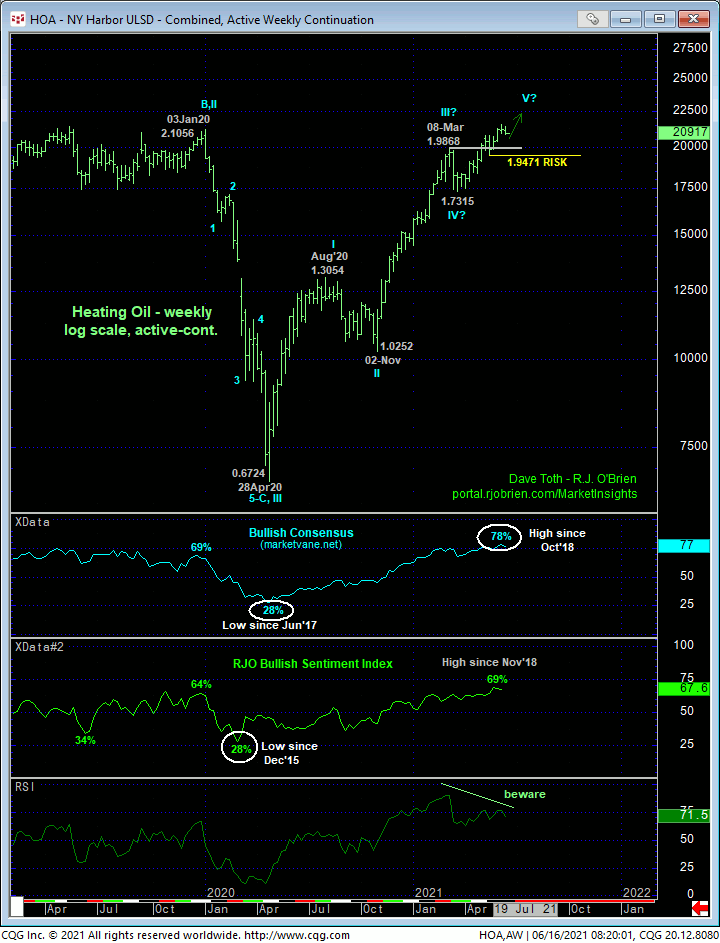
Longer-term threats to the diesel bull are the same as those listed above for crude, with Mar-Jun’s component of the bull about as textbook a 5-wave Elliott sequence as one can find. But since Fri’s mo failure is not of a sufficient scale to threaten the major bull, having held thus far at former 2.08-handle-area resistance-turned-support from early-may, it would be premature to conclude a broader top at this juncture. Commensurately larger-degree weakness below at least 21-May’s 1.9471 larger-degree corrective low and key risk parameter is required to threaten the secular bull enough to warrant defensive action by longer-term commercial players. And we doubt very highly that this market can prove that amount of weakness within the crude oil market rolling over as a peak/reversal-threat proxy.
These issues considered, a neutral/sideline policy remains advised for shorter-term traders with a recovery above 2.1560 required to negate this call, reinstate the major bull and require a return to a bullish stance. Longer-term players remain advised to maintain a bullish policy with a failure below 1.9471 required to negate this call and warrant its cover. Longer-term players also have the option of paring bullish exposure to more conservative levels as a result of last Fri’s mo failure, exchanging whipsaw risk (above 2.1560) for deeper nominal risk below 1.9471.
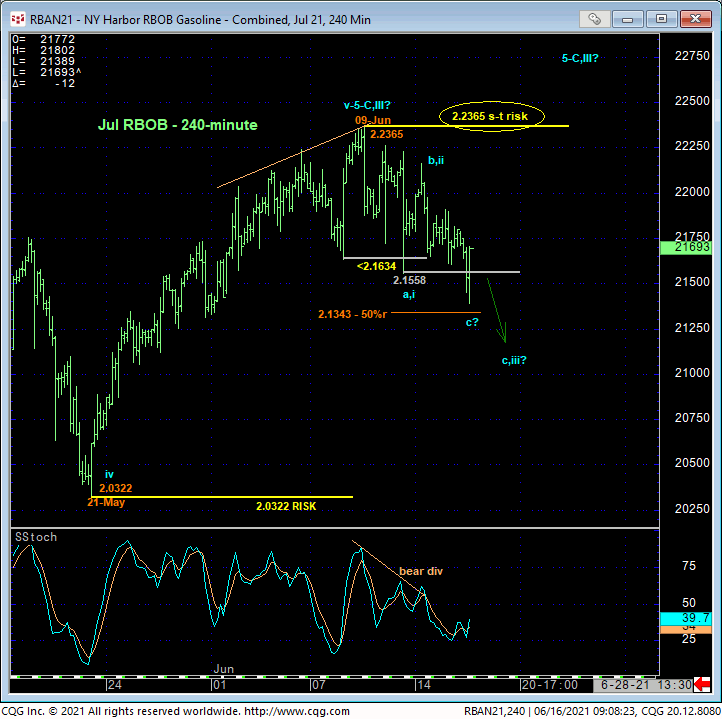
JUL RBOB
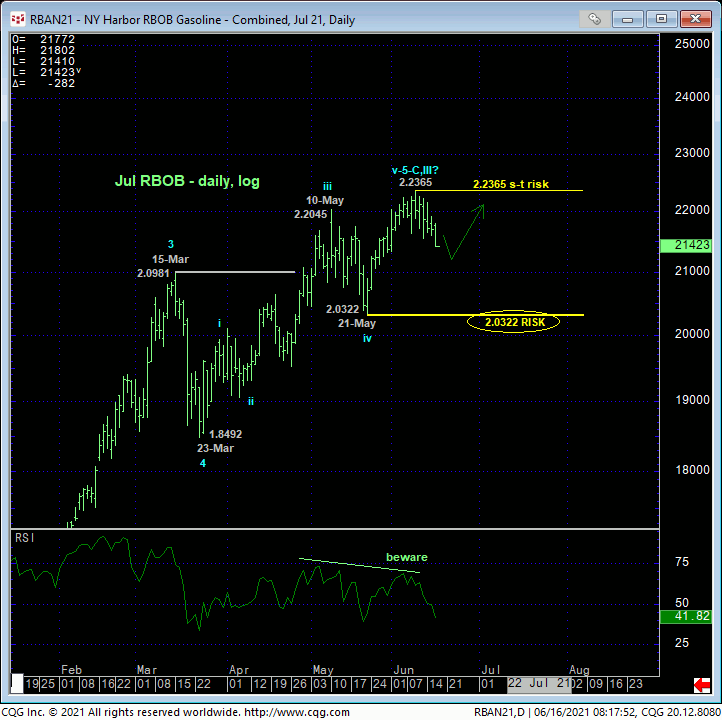
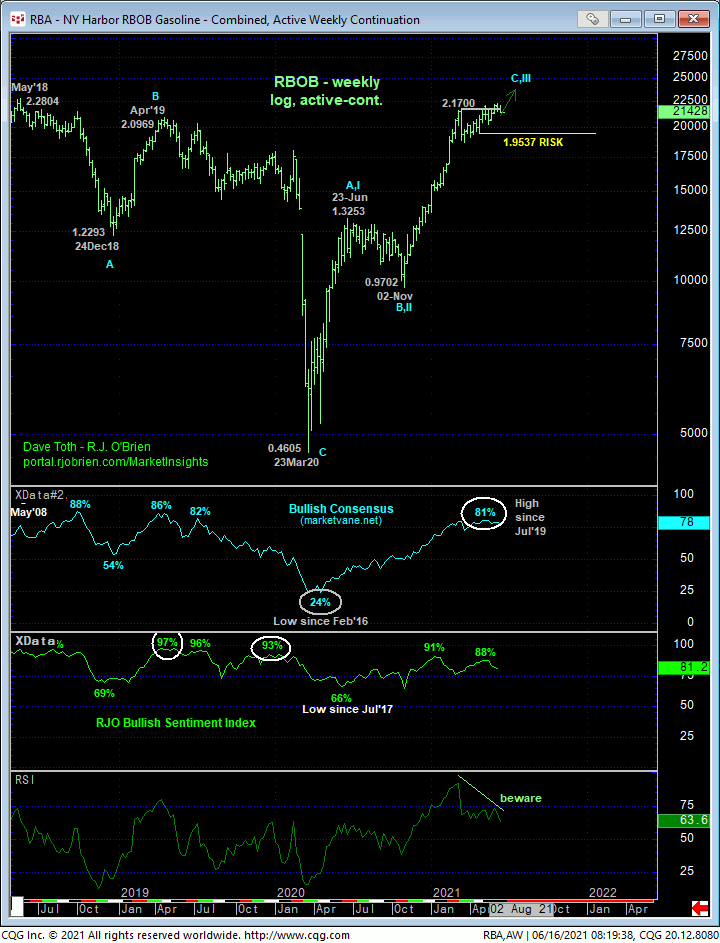
The technical construct, expectations and recommendation for Jul RBOB is identical to that detailed above for heating oil with 09-Jun’s 2.2365 high and 21-May’s 2.0322 low the key directional flexion points and risk parameters. The short-term trend is down until negated by a recovery above 2.2365 while the long-term trend remains up until negated by a failure below 2.0322. Traders are advised to toggle directional biases and exposure around these points commensurate with their personal risk profiles.
