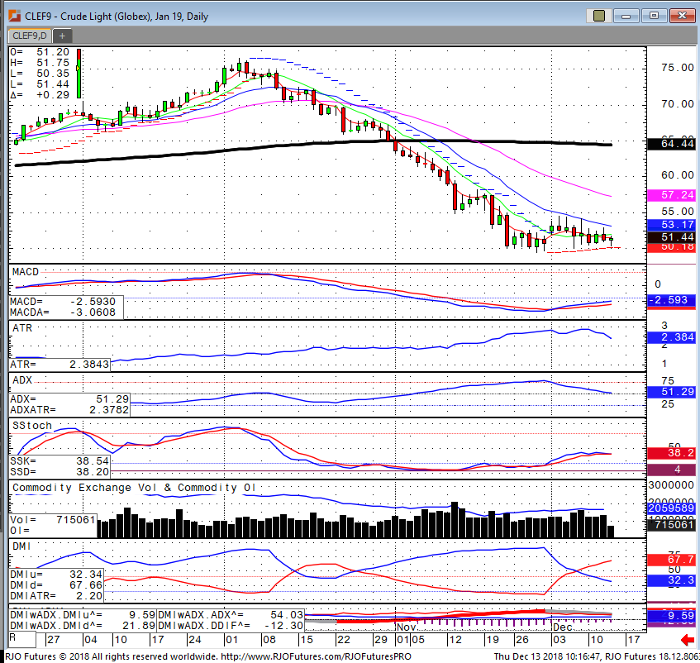
Crude oil futures continue to hold support at $50 and need to build off bullish developments that are in the works. Recently OPEC had cut production by 800,000 b/d and Russia joined in by cutting 400,000 b/d. While global economic data has slowed in recent weeks we should see a pickup in 2019 after the FED completes its interest rate cycle. Also if trade tensions with China can continue to ease this should provide the underlying support to boost oil through near term resistance at $55. Looking at the daily January crude oil chart you can see that it has formed a base right at $50. While the average true range sits at $2.38 /d if crude can string together two or three straight days in the same direction another bull or bear move would be in the works.
Crude Light Jan ’19 Daily Chart


