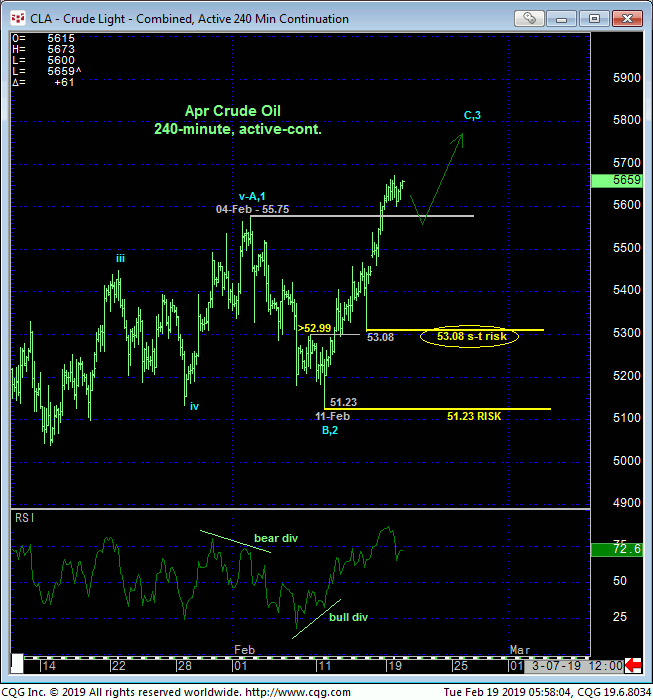
Fri’s recovery above 04-Feb’s 55.75 high and our short-term risk parameter nullifies early-Feb’s bearish divergence in momentum and chalks up the sell-off attempt to 11-Feb’s 51.23 low as a correction within the broader base/reversal count from 24-Dec’s 42.36 low. The 240-min chart below shows that this resumed strength leaves smaller- and larger-degree corrective lows in its wake at 53.08 and 51.23 that the market is now required to fail below to threaten or negate a resumed bullish count and policy. Per such these levels represent our new short- and longer-term risk parameters from which a resumed bullish policy can now be objectively rebased and managed. Former 55-handle-area resistance would be expected to hold as new support per any broader and more immediate bullish count.


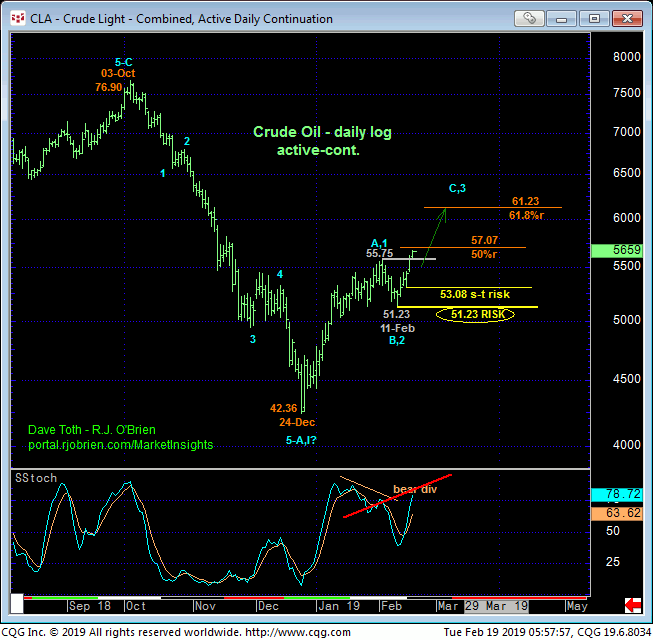
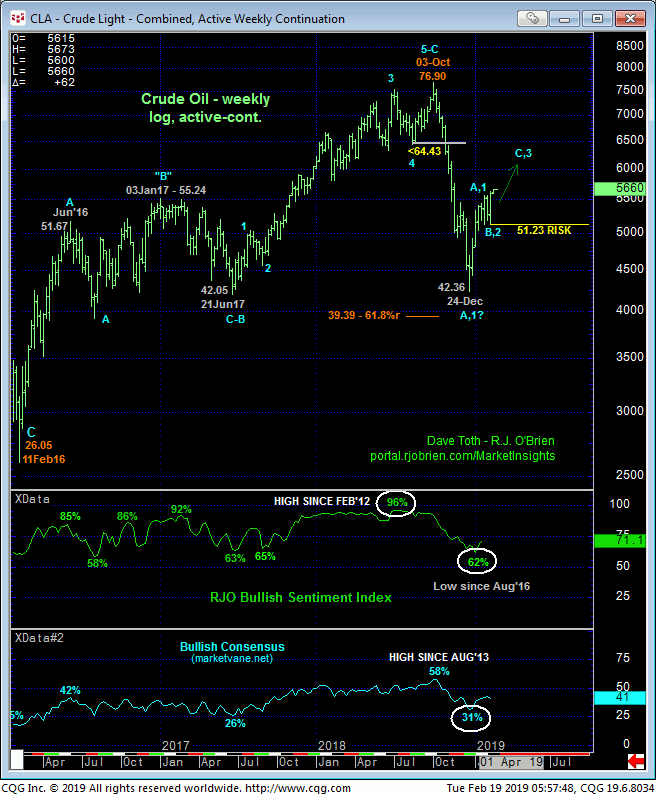
The daily (above) and weekly (below) log scale charts shows the resumption of an uptrend that dates from 24-Dec’s 42.36 low that now requires a failure below 51.23 to negate. In lieu of such sub-51.23 weakness this market has rejoined diesel and RBOB if the major correction or reversal of 4Q18’s meltdown. And given the extent and uninterrupted nature of that 4Q massacre that left little in the way of consolidative battlegrounds on the way down that may now be looked to as resistance candidates on the way back up, the current rebound may be just as trendy and impulsive and relentless.
The market is encroaching on the (57.07) 50% retrace of Oct-Dec’s 76.90 – 42.36 decline, but in the absence of an accompanying confirmed bearish divergence in momentum needed to, in fact, stem the clear and present uptrend, this Fibonacci relationship, like ALL mere derived technical levels, means nothing and is NOT considered resistance. We only reference it relative to the prospect for a bearish divergence in momentum that highlights recent corrective lows and risk parameters like 53.08 and certainly 51.23

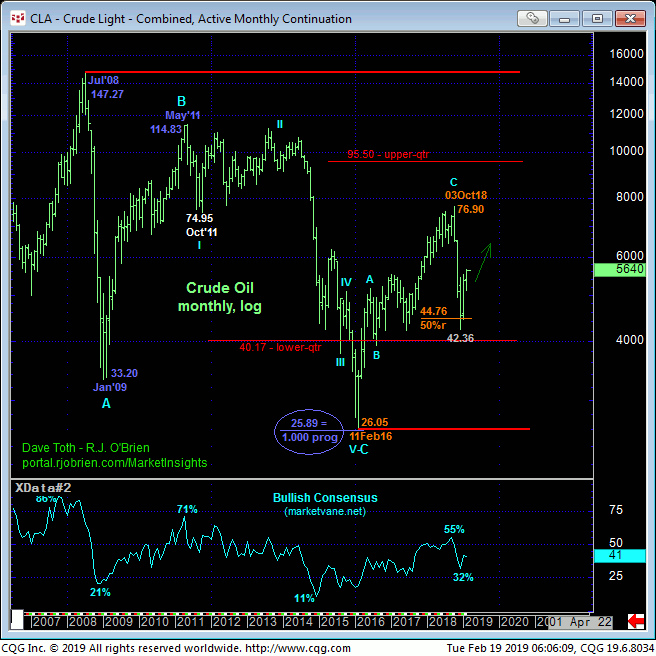
While the past couple months’ uptrend has resumed and could exposes potentially sharp gains from most trader’s perspectives, from a historical perspective shown in the monthly log chart below the market’s current position pretty much smack in the middle of the middle-half of the past 11 or 12 years’ range cannot be underestimated as a condition or situation or affliction that warns of what could be aimless whipsaw risk for quarters or even years ahead. Initiating directional exposure from such range-center environs presents poor risk/reward merits for, in this case, very long-term players unless a tight but objective risk parameter can be identified. Herein lies the importance of corrective lows and risk parameters like 11-Feb’s 51.23 low, the failure below which would negate a more immediate bullish count and expose a steeper correction of the rally from the Dec low. in lieu of such sub-51.23 weakness the extent of the current rebuttal to 4Q18’s decline is indeterminable and potential steep, if within the 40-to-95 middle-half bounds of the 11-year range.
These issues considered, traders are advised to return to a bullish policy and first approach setback attempts to former 55.50-area resistance-turned-support as corrective buying opportunities ahead of further and possibly protracted gains in the weeks or months ahead. A failure below 53.08 is required for shorter-term traders to move to the sidelines and long-term players to pare bullish exposure to more conservative levels. In lieu of such weakness further and possibly accelerated gains are expected.


