Posted on Aug 04, 2022, 07:47 by Dave Toth
SEP CRUDE OIL
Yesterday’s late and overnight’s break below 14-Jul’s 90.56 low confirms the 2-week recovery attempt from that low to 29-Jul’s 101.88 high a 3-wave correction, reinstates the downtrend from 14-Jun’s 123.68 high and reinforces our major peak/reversal count. As a direct result of this latest spat of weakness, the 240-min chart below shows that the market has identified yesterday’s 96.57 high and that 101.88 high as the latest smaller- and larger-degree corrective highs this market now must recoup to defer or threaten a more immediate bearish count. Per such, these levels represent our new short- and long-term risk parameters from which a bearish policy and exposure can be objectively rebased and managed.
Former 90.56-to-92.42-area support is considered new near-term resistance ahead of further and possibly protracted losses.


The daily log chart below shows today’s break to another new lows for the developing downtrend from 14-Jun’s 123.68 high. On a broader scale and as we’ve been discussing for a few weeks, the weekly close-only chart shows the unique and compelling combination of:
- a confirmed bearish divergence in WEEKLY momentum amidst
- historically frothy sentiment/contrary opinion levels
- a textbook complete 5-wave Elliott sequence up from Aug’21’s 61.86 low that we believe completes
- a
textbook 3-wave rally from Apr’20’s 17.18 low in which
- the completing and suspected C-Wave from Aug’21’s 61.86 low is virtually identical in length (i.e. 1.000 progression) to Apr’20 – Jun’21’s suspected A-Wave rally from 17.18 to 75.19.
This combination of technical facts and observations warns of a peak/reversal threat that could be major in scope, a threat that is reinforced by today’s break below 90.56 and intact until and unless this market can recoup at least 96.57 and preferably 101.88.
In terms of identifying new risks to this major bearish count, there is one deferral and one still-arguable alternate bullish count we must acknowledge.
As for an alternate bullish count, the 5-wave impulsive decline from 14-Jun’s 123.68 high could be the completing C-Wave of a major 4th-Wave correction from 07-Mar’s 130.50 high. Given the magnitude of the secular bull trend from 2020’s low, this 5-month, 31% decline still falls well within the bounds of a correction. To give this alternate bullish count a chance of performing, this market must arrest this clear and present downtrend SOON, recover above 101.88 AND SUSTAIN TRENDY, IMPULSIVE BEHAVIOR HIGHER THEREAFTER.
A deferred bearish count also requires a recovery above 101.88. But since the decline from the Jun high is an arguable 5-wave impulsive animal we would EXPECT for the 1st-wave of a new major bear trend, a not unexpected 2nd-Wave rebuttal to this decline would be expected to unfold in a more labored, 3-wave affair that would set the stage for the dramatic 3rd-Wave meltdown thereafter. We can’t cross either bridge until and unless this market recovers above 101.88. And until such specific strength is shown, the tend is down and should not surprise by its continuance or acceleration straight away. Herein lies the importance of our defined specific risk parameters at 96.57 and 101.88.

On a very long-term basis, the monthly chart shows this market’s clear rejection thus far of the upper-quarter of its historical range where, from an Elliott Wave perspective, the 3-wave rally from Apr’20’s 6.50 low is considered a massive B-Wave within the event more massive lateral, “flat” range that dates from 2008’s 147.27 all-time high. If correct, this count suggests this market is in the embryonic stage of a massive and (5-wave) impulsive C-Wave down to its lower-quarter somewhere below $40 in the years ahead. Between now and “then” however (whenever “then” is), this market could be prone to immense aimless whipsaw risk from the middle-half of this historical range between roughly 110 and 40 and similar to the rice action between roughly 2009 and 2019. The takeaway from this long-term chart is that the risk/reward metrics of a long-term bullish policy above rough $110 are questionable at BEST and likely poor.
These issues considered, a bearish policy and exposure are urged with a recovery above at least 96.57 and certainly 101.88 required to take defensive measures commensurate with one’s personal risk profile. In lieu of such strength, further and possibly protracted losses straight away should not surprise.

SEP RBOB

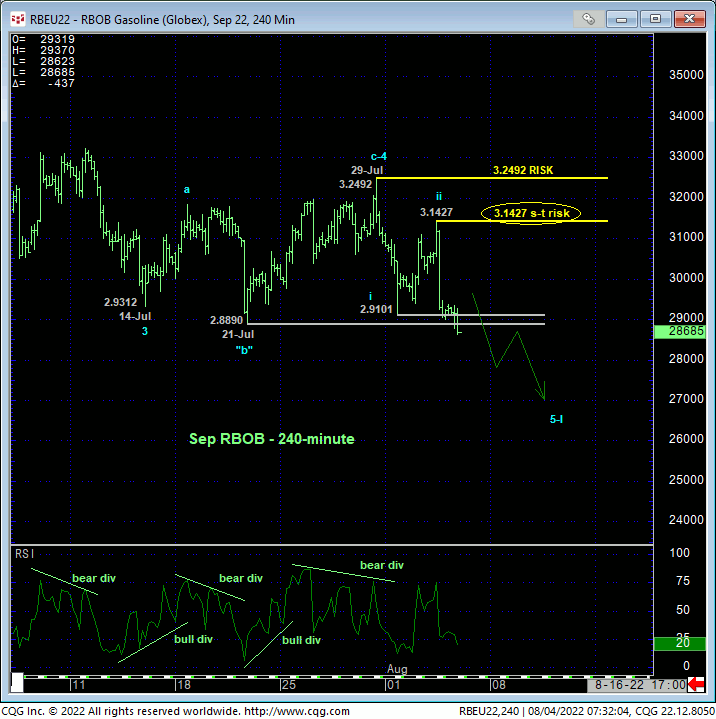
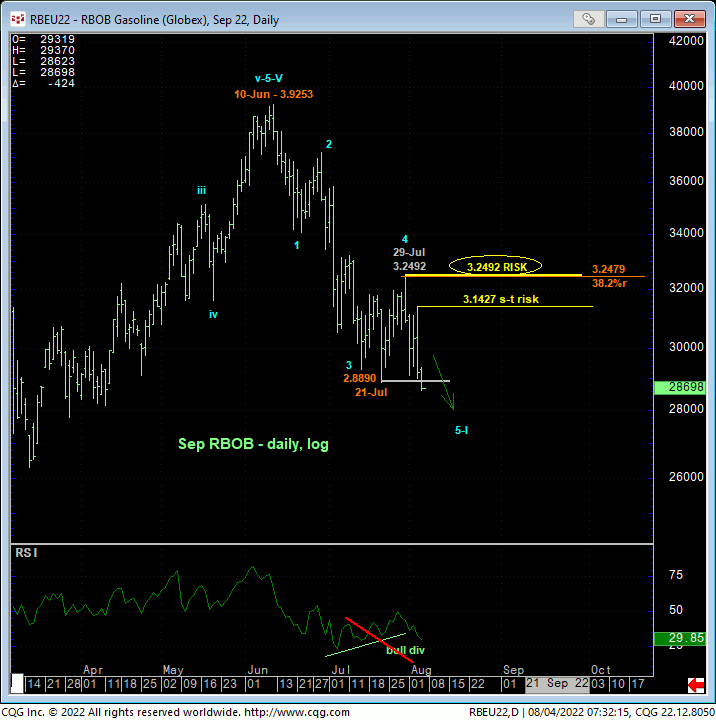
The technical construct of the RBOB market is identical to that detailed above for crude oil after today’s break below 21-Jul’s 2.8890 low nullified last week’s bullish divergence in daily momentum and reinstated the downtrend from 10-Jun’s 3.9253 high and what we believe is a major peak/reversal process. The key resulting benefit of this resumed weakness is the market’s specific definition of smaller- and larger-degree corrective highs at 3.1427 from yesterday and 3.2492 from 29-Jul that it now must recoup to threaten and then negate the 2-month downtrend. Until and unless such strength is shown, the trend is down and should not surprise by its continuance or acceleration straight away.

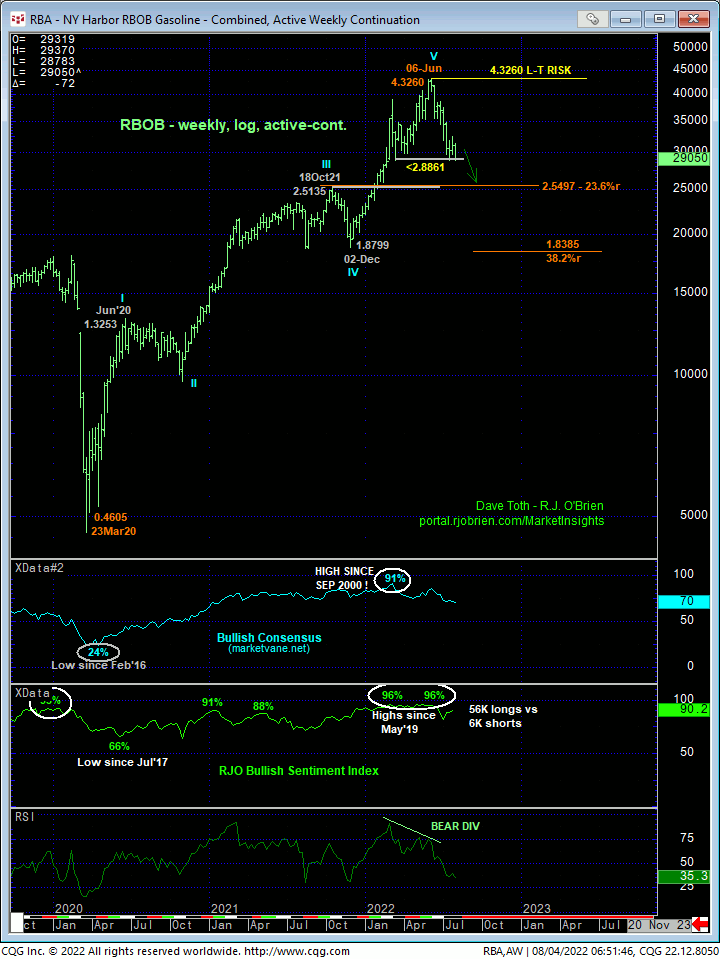
It’s also crucial to understand the SCALE of the current downtrend and its 5-wave impulsiveness that is consistent with the 1st-Wave of a major reversal. The weekly log chart below shows the same unique and compelling combination of factors that warn of a major top and reversal:
- a confirmed bearish divergence in WEEKLY momentum amidst
- historically frothy sentiment/contrary opinion levels and
- a textbook complete 5-wave Elliott sequence from Mar’20’s 0.4605 low.
A recovery above Jun’s 4.3260 high is required to negate this call. A recovery above 3.2492 will, however, break the 5-wave downtrend from the Jun high and expose a 2nd-Wave corrective rebound that could be extensive, warranting a move from bearish to neutral or even cautiously bullish. Until and unless this market recovers above at least 3.1427 and especially 3.2492 however, further and possibly accelerated losses straight away are expected, warranting a continued or resumed bearish policy and exposure.

|
DAVE TOTH Market Insights Senior Analyst |

