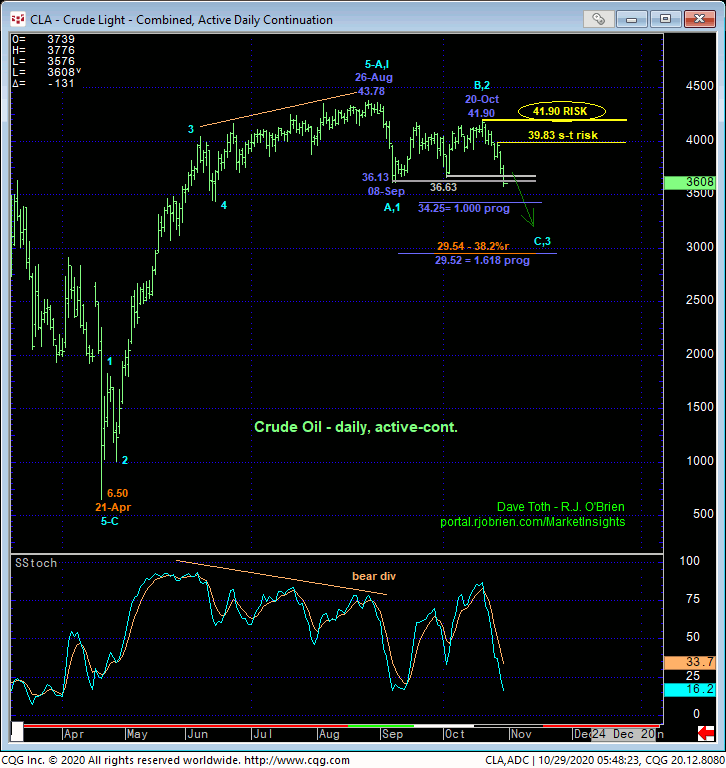
The market’s break overnight below the past month-and-a-half’s support from the 36.63-to-36.13-area reaffirms our peak/correction/reversal count introduced in 02-Sep’s Technical Webcast and exposes a vast chasm totally devoid of any technical levels of merit shy of 21-Apr’s 6.50 low. This doesn’t mean we’re forecasting a move to 6.50. But it certainly does mean that until and unless this clear and present resumed downtrend is stemmed by a confirmed bullish divergence in momentum, this market’s downside potential is indeterminable and potentially severe straight away.
In the daily chart below, we’ve noted “derived” (for what they’re worth) Fibonacci progression and retracement relationships at 34.25 and the 29.50-area. But these will only come into play IF/when a bullish divergence in momentum materializes around them. And such momentum failures require proof of strength above prior corrective highs.

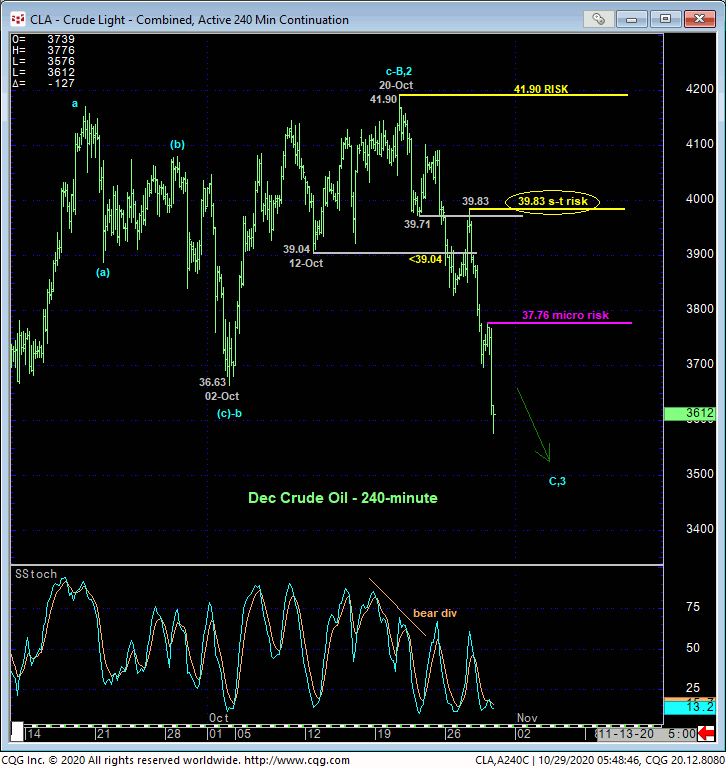
Drilling down, the 240-min chart below shows a number of recent corrective highs left in the wake of the past week’s developing downtrend. Obviously, 20-Oct’s 41.90 high defines THE KEY long-term risk parameter the market needs to recoup to render the broader sell-off attempt from 26-Aug’s 43.78 high a 3-wave and thus corrective structure that would then re-expose the major bull. Shorter-term and micro corrective highs at 39.83 and 37.76 identify smaller-degree risk parameters traders can objectively use commensurate with their personal risk profiles. Until the market recoups even our micro risk parameter at 37.76, the trend is down on all practical scales and should not surprise by its continuance or acceleration straight away.
Former lower-36-handle-area support, since breached, is considered new near-term resistance.

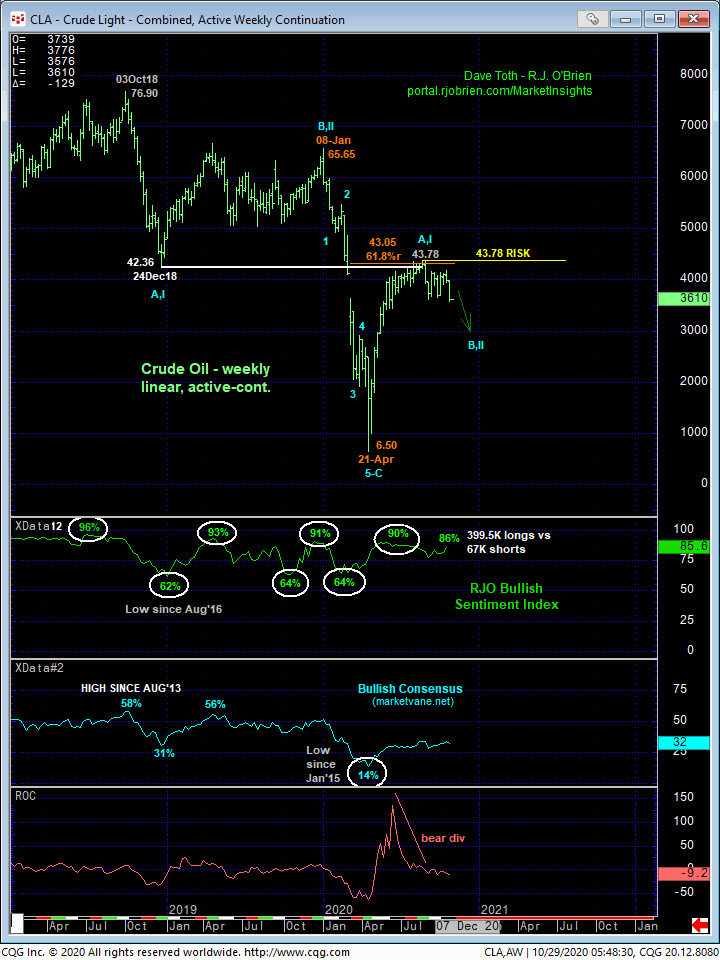
A key contributing factor to our peak/reversal count since mid-summer, AND STILL, are the frothy levels being maintained by our RJO Bullish Sentiment Index of the hot Managed Money positions reportable to the CFTC. Indeed, at a stubbornly high 86% currently reflecting 400K long positions versus just 67K shorts, this degree to which the CTA community has its neck sticking out on the bull side is fuel for downside vulnerability as the overall market may force the capitulation of this long-&-wrong exposure.
These issues considered, a bearish policy and exposure remain advised with strength above at least 37.76 and preferably 39.83 required to defer or threaten this call enough to warrant defensive measures. In lieu of such strength, further and possibly sharp losses are expected straight away.


