Posted on Aug 05, 2022, 06:32 by Dave Toth
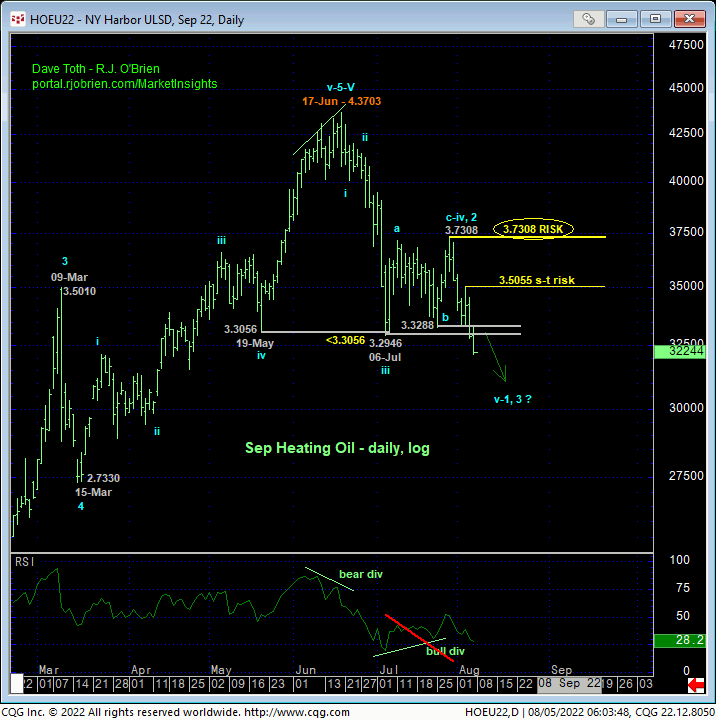
In yesterday morning’s Crude Oil and RBOB Technical Blog, we discussed these market’s breaks below their mid-Jul lows that reinstated their downtrends from their mid-Jun highs and reaffirmed our major peak/reversal counts. Overnight’s clear heating oil break below 06-Jul’s 3.2946 low confirms a similar count in heating oil, leaving smaller- and larger-degree corrective highs in its wake at 3.5055 and 3.7308 this market must now recoup to defer or threaten our broader bearish call and warrant defensive measures. Per such, these levels represent our new short- and long-term risk parameters from which traders can objectively rebase and manage the risk of a resumed or continued bearish policy and exposure. In lieu of a recovery above these levels, the trend is down on all practical scales and should not surprise by its continuance or acceleration straight away.
Former 3.2950-to-3.3300-area support is considered new near-term resistance.

Moving out to a daily log scale basis, the chart below shows today’s clear break below 06-Jul’s 3.2946 low and reaffirmation of the past month-and-a-half’s downtrend. At this point, it is indeterminable whether the decline from 28-Jul’s 3.7308 high is the completing 5th-Wave of an initial 1st-Wave of the major peak/reversal process OR the dramatic 3rd-Wave of an eventual 5-wave sequence down. As we always bias towards a count that is WITH the trend at hand, traders are advised to bet on the dramatic 3rd-Wave count that would be expected to produce steep, even relentless losses straight away.
Herein lies the importance of the corrective highs and risk parameters at 3.5055 and 3.7308. IF this decline is that 3rd-Wave we suspect, we would NOT expect this market to recoup even 3.5055, let alone 3.7308. If/when it does, we’ll prepare to navigate a 2nd-Wave corrective rebuttal to Jun-Aug’s decline that could push prices back up to the 3.75-to-4.00-area or higher. Until and unless such specific strength is shown however, we believe the market’s downside potential is indeterminable and potentially extreme straight away.


From a long-term perspective, traders are reminded that our major peak/reversal count is predicated on the following facts and observations:
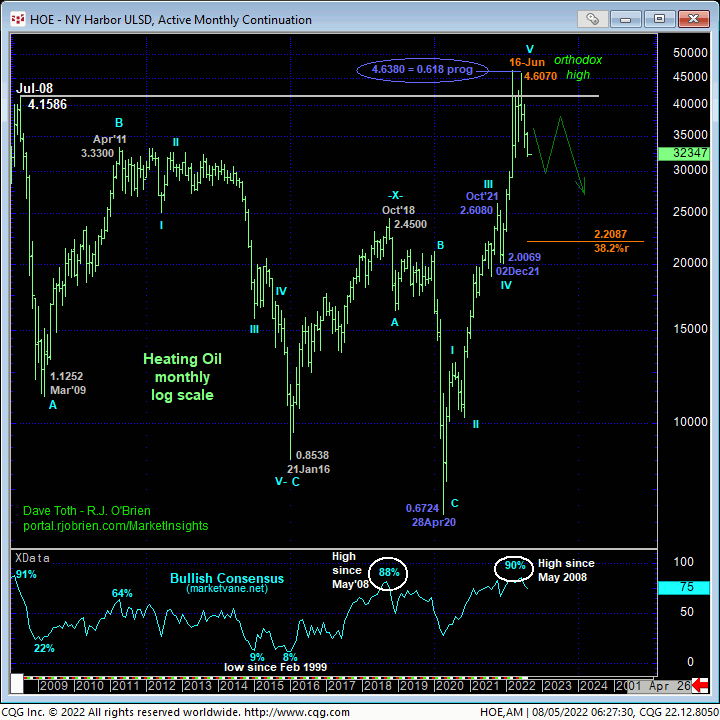
- a confirmed bearish divergence in WEEKLY momentum below 19-May’s 3.4274 corrective low shows in the weekly log active-continuation chart above amidst
- historically frothy levels in the Bullish Consensus (marketvane.net) not seen since those that warned of and accompanied 2008’s massive top
- a
textbook complete 5-wave Elliott sequence from Apr’20’s 0.6724 low in
which
- the completing 5th-Wave from 02Dec21’s 2.0069 low came within 3-cents of the (4.6380) 0.618 progression of the net distance of Waves-1-thru-3 (0.6724 – 2.6080)
- the market’s gross failure to sustain this year’s break above 2008’s previous all-time high of 4.1586 shown in the monthly log chart below.
If correct, our major peak/reversal count calls for a major reversal of a 26-month, 585% bull move from 0.6724 to 4.6070 where a Fibonacci MINIMUM 38.2% retrace doesn’t cut across until the 2.2087-area.
These issues considered, a full and aggressive bearish policy and exposure are advised with a recovery above 3.5055 required for shorter-term traders to move to the sidelines and commensurately larger-degree strength above 3.7308 required for longer-term players to follow suit. In lieu of such strength, further and possibly accelerated losses are expected straight away.


